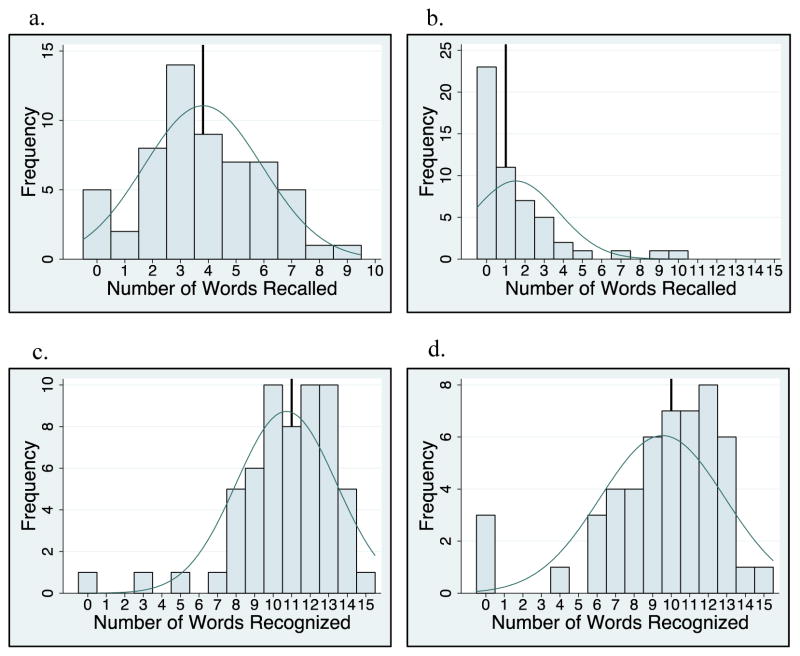
Figure 2. Memory Scores.
Histogram of memory score distribution with superimposed normal distribution curve and solid vertical line representing the mean or median. a. Immediate recall scores were normally distributed. Mean = 3.81 word. b. Delayed recall scores showed right skew. Median = 1 word. c. Immediate recognition scores showed left skew. Median = 11 words. d. Delayed recognition scores also showed right skew. Median = 10 words.

