
Fig. 3. Relative expression of putative invariant TCRα gene rearrangements in response to FV3 infection and heat killed bacterial challenge.
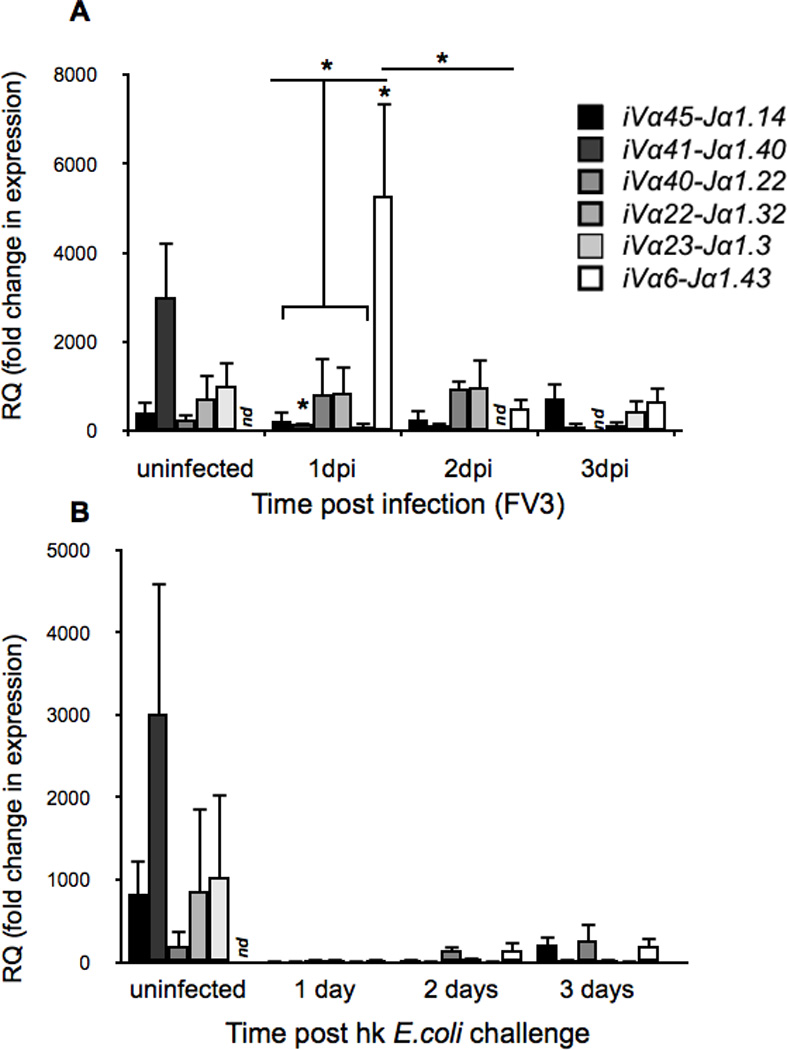
Relative expression of the six predominant invariant TCRα rearrangements (Vα45-Jα1.14, Vα41-Jα1.40, Vα40-Jα1.22, Vα23-Jα1.3Vα22-Jα1.32 and iVα6-Jα1.43) following (A) i.p. FV3 infection (1 × 10⁶ PFU) or (B) intraperitoneal challenge with heat-killed E.coli. Results are normalized to an endogenous control and presented as fold change in expression compared with the lowest observed tissue expression. (iVα23 2 days post E.coli challenge). All results are presented as mean ± SE (n=5/treatment group), *P < 0.05 denotes statistical significance relative to respective uninfected controls and *P < 0.05, when over bars denotes differences between groups denoted by the bars. nd = not detected