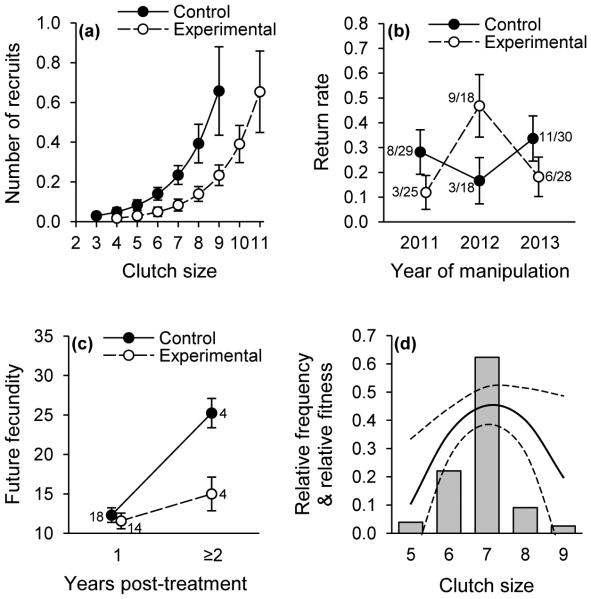
Fig. 2.
(a) Number of recruits (± SE) in relation to clutch size and treatment. (b) Rates at which females returned to breed in the population in the year following their inclusion in the experiment. (c) Cumulative future fecundity (number of eggs produced) by females that were included in the experiment and not manipulated in subsequent breeding seasons. (d) Distribution of clutch sizes among unmanipulated females (relative frequency; filled bars); curves represent the relative fitness (i.e., the lifetime number of fledglings relative to the population maximum) of these females (quadratic regression ± 95% confidence limits).

