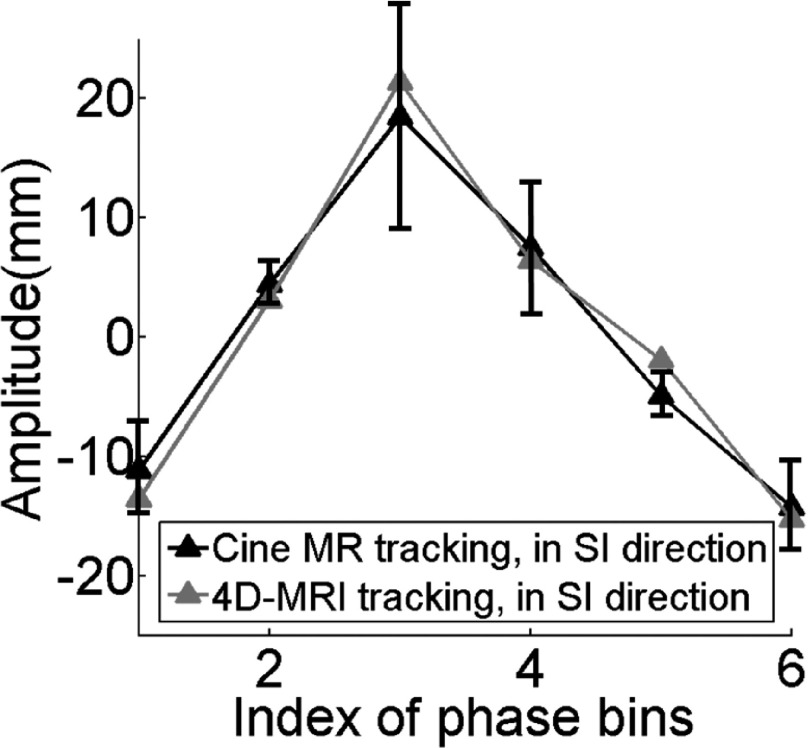
FIG. 12.
Critical structure trajectories from 4D-MRI matched well with those from single-slice cine MR. The error bar shows the motion range of one critical structure (vessel) measured on cine MR at different breathing cycles for each respiratory phase. This figure shows the results of one representative healthy volunteer.

