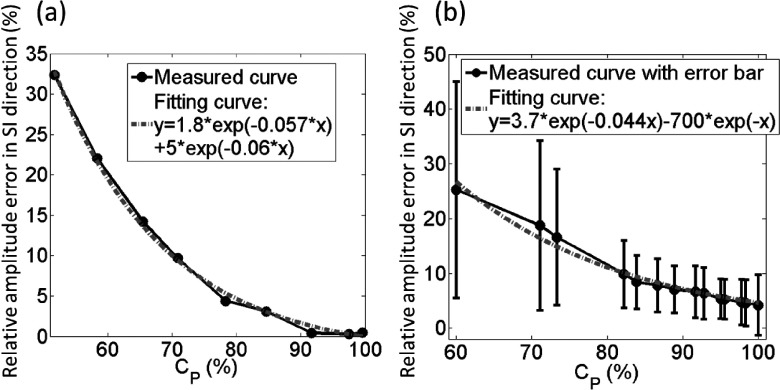
FIG. 8.
Relationship between percentage of completeness (Cp) and the relative amplitude error of tumor trajectory in SI direction. These figures show XCAT simulation results using (a) strictly regular breathing motion and (b) 29 patients’ breathing profiles. In both cases, the relative amplitude error decreases as the percentage of data completeness increases and reaches a stable stage at approximately 95% of data completeness.

