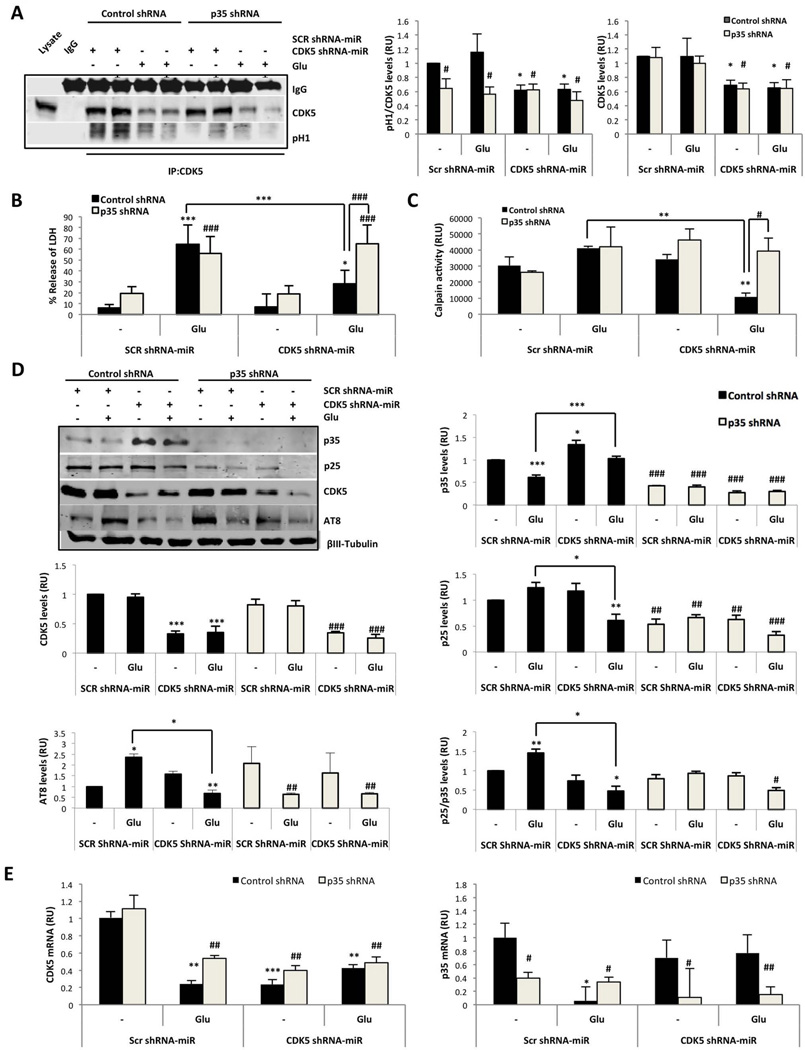
Figure 3.
CDK5 shRNA-miR-induced neuroprotection required p35. (A) CDK5 kinase activity was assessed for 30 min. CDK5 IP and western blot analyses of CDK5 and p-H1 are represented. Quantification of the intensity of CDK5 and p-H1 proteins was performed. RU, relative units. n = 3. (B) Neuronal cytotoxicity is presented as the percentage of LDH release. The data are presented as the means ± SEM of n = 3. (C) Calpain activity at 24 h after glutamate excitotoxicity in neurons transduced with SCR or CDK5 shRNA-miR or with control or p35 shRNA. Relative light units =RLU. (D) The p35, p25, p35/p25 ratio, CDK5 and AT8 protein levels. (E) CDK5 and p35 mRNA expression at 24 h after glutamate excitotoxicity in neurons transduced with SCR or CDK5 shRNA-miR or with control or p35 shRNA. Relative units= RU, n=5. All values were normalised to the control neurons and are presented as the means ± SEM. Control shRNA: black bars and p35 shRNA: grey bars. * represents comparison between each treatment of control shRNA neurons or # p35 shRNA neurons. * or + p<0.05, ** or ## p<0.01, *** or ### p<0.001; ANOVA with Tukey’s test (A, B and D) or Kruskal Wallis’ test with Dunn’s analysis (C and E).

