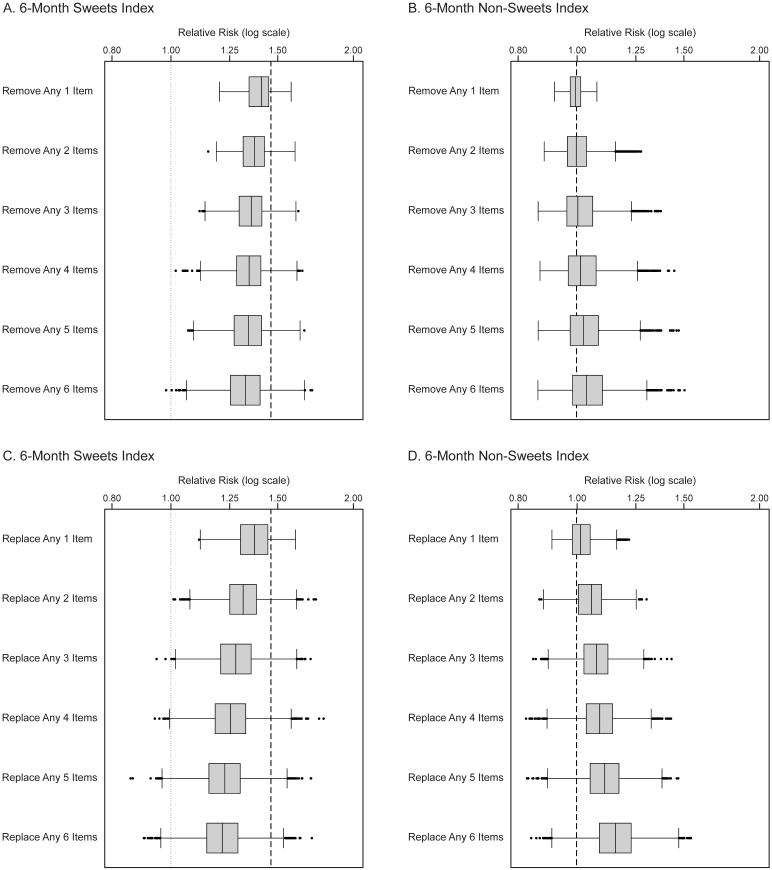
Figure 2. Sensitivity analyses for the 6-month sweet and non-sweet indexes.
Legend: Box plots show variation in point estimates of the adjusted relative risk (log scale) for severe early childhood caries (outcome) comparing the uppermost to lowermost tertile of each index (exposure), under random removal of any set of items from the 6-month sweet index (panel A) and 6-month non-sweet index (panel B), or under random removal from the 6-month sweet index with random replacement from the 6-month non-sweet index (panel C), or under random removal from the 6-month non-sweet index with random replacement from the 6-month sweet index (panel D). Heavy dashed lines show the point estimate for the adjusted relative risk as the indexes were originally constructed: 1.46 for the 6-month sweet index and 1.00 for the 6-month non-sweet index. Boxes reflect the 25th, 50th, and 75th percentile values; whiskers reflect the lower and upper adjacent values.

