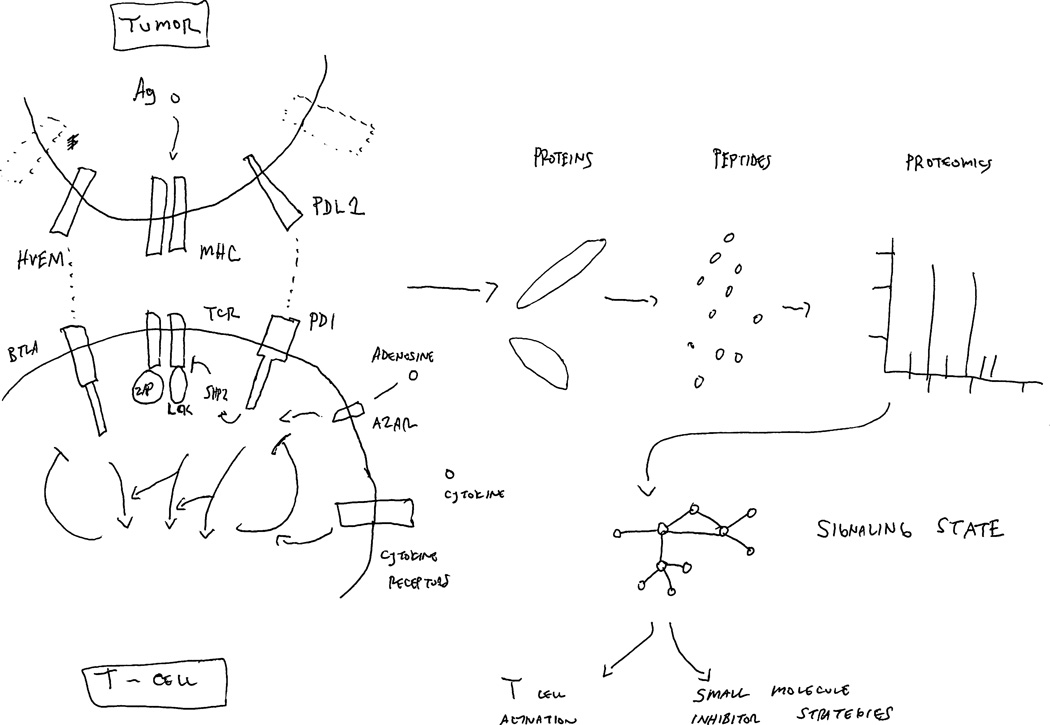
Figure 1. Proteomic dissection of molecular snapshot of T-cell activation circuits.
The tumor cell:T cell interface initiates a complex signaling environment beginning with MHC/peptide-antigen activation of the T-cell receptor (TCR) along with inputs of other co-stimulatory or inhibitory signaling events, shown as HVEM/BLTA or PD-L1/PD-1 in this cartoon, as well as adenosine signaling through its receptor (A2AR) or cytokines. These along with other immune checkpoints, as well as signals driven by tumor stromal signals such as adenosine, cooperate to drive a signaling network resulting in effector signaling events (ERK, AKT, STAT) within T cells. While shown for simplicity within this cartoon, the system behaves similar to other complex regulatory signaling circuits in normal cells or tumor cells, consisting of many adaptor proteins, signaling kinases and phosphatases, and connected within feedback loops. To comprehend this complexity, mass spectrometry facilitates the dissection of these networks by quantification of peptides and post-translationally modified (phosphorylated, acetylated, ubiquitinated) peptides and can do so in a dynamic fashion. Ultimately, this knowledge can be converted into network maps of T-cell signaling that enables molecular snapshots of T-cell activation circuits and can facilitate a strategy to insert small molecules onto this network.

