Abstract
Eos is a transcription factor that belongs to the Ikaros family of transcription factors. Eos has been reported to be a T regulatory cell (Treg) signature gene, to play a critical role in Treg suppressor functions, and to maintain Treg stability. We have utilized mice with a global deficiency of Eos to re-examine the role of Eos expression in both Treg and T conventional (Tconv) cells. Treg from Eos deficient (Eos−/−) mice developed normally, displayed a normal Treg phenotype, and exhibited normal suppressor function in vitro. Eos−/− Treg were as effective as Treg from wild type (WT) mice in suppression of inflammation in a model of inflammatory bowel disease. Bone marrow (BM) from Eos−/− mice was as effective as BM from WT mice in controlling T cell activation when used to reconstitute immunodeficient mice in the presence of Scurfy fetal liver cells. Surprisingly, Eos was expressed in activated Tconv cells and was required for IL-2 production, CD25 expression and proliferation in vitro by CD4+ Tconv cells. Eos−/− mice developed more severe Experimental Autoimmune Encephalomyelitis than WT mice, displayed increased numbers of effector T cells in the periphery and CNS, and amplified IL-17 production. In conclusion, our studies are not consistent with a role for Eos in Treg development and function, but demonstrate that Eos plays an important role in the activation and differentiation of Tconv cells.
Introduction
Eos (encoded by Ikzf4) is a transcription factor that belongs to the Ikaros family of transcription factors (1). The Ikaros family has five distinct members (Ikaros, Helios, Aiolos, Eos and Pegasus), and all of the family members participate in important decision making during hematopoiesis and adaptive immunity (2). Each family member has two-conserved zinc finger motifs, one at the N-terminus and the other at the C-terminus. N-terminus zinc fingers are important in DNA binding, while the C-terminus motif plays a role in homodimerization or heterodimerization with other family members (3). Eos, similar to Ikaros, Helios and Aiolos, recognizes the ‘GGAAA’ binding sequence, whereas Pegasus binds to non-canonical ‘GNNNGNNG’ sequence (4).
Eos was initially described as expressed in the developing nervous system and brain (1, 5). More recently, its role in T regulatory cells (Treg) has been under investigation. Pan et al (6) demonstrated that Eos was preferentially expressed in Treg, and silencing of Eos with siRNA resulted in loss of suppressive function in Treg and gain of effector-like phenotype accompanied by the production of IL-2 and IFN-γ. The interaction of Eos with Foxp3 and CtBP1 was required in order to silence IL-2 production in Treg. Eos has been characterized as a Treg signature gene, and some groups demonstrated that stable Foxp3 expression coincided with demethylation of the Eos promoter (7). However, global deletion of Eos did not alter the Treg gene signature, as deletion of more than one signature gene is needed to change the gene expression profile (8). More recently, under certain inflammatory conditions, downregulation of Eos expression was shown to be required for reprogramming of Treg into helper-like cells (9). The “Eos-labile” Treg population expressed the proinflammatory cytokines IL-2 and IL-17, accompanied by upregulation of CD40L and licensing of dendritic cells. Surprisingly, in this study, loss of Eos expression in the reprogrammed Treg was not accompanied by loss of Foxp3 expression.
In the current study, we have utilized mice with a global deficiency of Eos to re-examine the role of Eos expression in both Treg and T conventional (Tconv) cells. Our results showed that deletion of Eos did not result in an altered phenotype of Treg in vitro and in vivo. Interestingly, we showed that Eos was expressed in activated Tconv cells, and that Eos was required for IL-2 production by CD4+ Tconv cells in vitro. Eos deficient (Eos−/−) mice developed more severe Experimental Autoimmune Encephalomyelitis (EAE) with increased effector T cells (Teff) in the periphery and CNS and amplified IL-17 production. In conclusion, our studies are not consistent with a role for Eos in Treg development and function, but demonstrate that Eos plays an important role in the activation and differentiation of Tconv cells.
Materials and Methods
Mice
Wild type (WT) C57BL/6 (CD45.2), WT C57BL/6 (CD45.1), and RAG−/− mice were obtained from Taconic Farms (Germantown, NY). Eos−/− mice were bred in house. Eos−/− mice were generated by deleting the last three exons of the gene (Supplemental Fig. 1A). Deletion of the last coding exon from other Ikaros family paralogues has resulted in a functional null allele and mice homozygous for this Eos−/− allele lack expression of Eos mRNA and protein. Scurfy mice were obtained from Jackson Laboratories (Bar Harbor, ME). Eos−/− Foxp3-GFP mice were generated in house by breeding to Foxp3EGFP mice (Jackson Stock No:006769). The Animal Care and Use Committee of the National Institute of Allergy and Infectious Diseases (NIAID) approved all experiments.
mRNA isolation, cDNA production, and real-time PCR
RNA was extracted using RNeasy columns (Qiagen), and cDNA was synthesized by using iScript cDNA synthesis kit (Bio-Rad) according to the manufacturer’s instructions. Eos expression was measured by using Taqman Gene Expression Assay (Applied Biosystems, Mm01133256_m1), and β-actin was used as an internal control. Relative expression to β-actin was reported in all experiments. Real-time PCR was conducted with the ABI Prism 7900HT, using TaqMan Universal PCR Master Mix (Applied Biosystems).
Isolation of human CD4+T cells
Buffy coats were obtained from the NIH Blood Bank and lymphoyctes were isolated by ficoll separation. After washing with PBS, CD4+ cells were separated using Miltenyi autoMACS. The positively selected cells were then stained with CD4, CD25 and CD127 and were sorted for CD4+CD25+CD127− Tregs and CD4+CD25−CD127+ Tconv cells. Both cell populations were expanded for 2 weeks in vitro by culturing them with anti-CD3/CD28 coated beads (Invitrogen Catalog # 111-31D) at a ratio of 3 beads to 1 cell. For Treg cultures, IL-2 (300 U/ml) and Rapamycin (100 ng/ml) were also added to the cultures.
Flow cytometry and cell sorting
Cell surface staining was performed with the following anti–mouse antibodies (BD Bioscience or eBioscience): anti-CD4 (RM4-5), −CD8 (53-6.7), −CD19 (1D3), −CD25 (7D4), −CD44 (IM7), −CD45.1 (A20), −CD45.2 (104), −CD62L (MEL-14), −CD69 (H1.2F3), −CD103 (2E7), −ICOS (7E.17G9). For intracellular staining, cells were surface stained and then permeabilized with FixPerm buffer (eBioscience). Cells were then washed and stained with antibodies against Foxp3 (FJK-16s), Eos (ESB7C2), and Helios (22F6). For intracellular Eos staining, 1 ml of FixPerm buffer was added to single cell suspension, after surface staining, and incubated overnight. On the following day, the cells were washed three times with permeabilization buffer, and antibody was added (1:100 dilution) for 3 hours at 4°C. The cells were then washed extensively in order to reduce background staining before analysis. For IFNγ (XMG1.2) and IL-17 (eBio17b7) staining, cells were stimulated for 4 hours with cell stimulation cocktail plus protein transport inhibitor (eBioscience) and stained intracellularly. All antibodies were used at 1:200 dilution with the exception of Eos. MOG-tetramer-PE conjugated (38-49, GWYRSPFSRVVH) was synthesized by NIH Tetramer facility, and cells were stained with final concentration of 4 μg of tetramer solution in complete medium per 1 ×10⁶ cells for 3 hours at 37°C. The cells were then washed and stained with surface markers for an additional 15 minutes at room temperature. A dump gate was created by using anti-CD19, anti-NK1.1, anti-CD8 and anti-Cd11b (all in FITC) for more accurate analysis of antigen specific population. The LSRII (BD Bioscience) was used for data acquiring and samples were analyzed using FlowJo software (TreeStar). For cell sorting experiments, cells were labeled with different surface markers and sorted using a FACSAria flow cytometer (BD Biosciences).
Western Blotting
Nuclear lysates were prepared by using NE-PER Nuclear and Cytoplasmic extraction reagents (Thermo Scientific) according to the manufacturer’s instructions. The proteins were separated by 12% SDS-polyacrylamide gel electrophoresis and transferred onto polyvinylidene difluoride membranes. The membranes were placed in 5% dry milk blocking buffer for 1h on a shaker at room temperature. The membranes were then washed and incubated with unconjugated α-Eos (1:1000) overnight at 4°C. On the next day, the membranes were washed, and incubated with secondary antibody (anti-rat IgG) for 3h at 4°C. The membranes were washed extensively and incubated in developing solution (GE Healthcare, Chalfont St. Giles, Buckinghamshire, UK) for 5 minutes before exposure. Expression of β-actin was used as loading control.
BrdU staining
Mice were injected with 1 mg BrdU i.p. and sacrificed 24h later. BrdU incorporation was detected in splenocytes using BrdU Flow kit (BD Bioscience) and Ki-67 staining was performed with Flow kit (BD Bioscience).
In vitro suppression assay
Naíve WT cells (CD4+CD25− CD62LhighCD44low) were FACS-sorted from spleen and lymph node of mice. In some experiments Eos−/−Foxp3-GFP mice were used to sort naíve cells. Naíve cells (5×10⁴) were placed in 96-well plates with irradiated autoMACS-sorted T-depleted splenocytes (5×10⁴) with soluble anti-CD3 (1 μg/ml). In some cultures, either sorted CD4+CD25+ or CD4+Foxp3-GFP+ cells were added in indicated numbers for 72 hours. Cultures were pulsed with [3H]-thymidine for the last 6h of culture. In a different set up experiments, cell proliferation was measured by labeling the naíve T cells with cell proliferation dye (eBioscience) according to manufacturer’s instructions.
Inflammatory bowel disease (IBD)
Naíve WT cells (CD4+GFP− CD62LhighCD44low, 4×10⁵) were FACS-sorted from spleen and lymph node of mice, and injected into RAG−/− mice in the absence or presence of WT or Eos−/− Treg (CD4+GFP+, 2×10⁵). Initial weight of mice was measured before injection of cells, and weight loss was monitored for 6 wk. Percent change in weight was calculated using the initial weight of mice. All mice in each experiment were sacrificed when any individual mice showed clinical signs of severe disease or 20% weight loss.
Scurfy fetal liver and Bone marrow (BM) chimeras
To generate chimeric mice, the recipient RAG2−/− mice were lethally irradiated with two doses of 500 Rads of total body irradiation, injected i.v on the same day with BM cells (1×10⁶) or fetal liver cells (2×10⁵) from donor mice, and allowed to reconstitute for 6 to 8 wk. The fetal liver cells were obtained at 15 d gestation; the cells were screened for the Scurfy mutation by PCR. For other BM chimeras, WT or Eos−/− cells (1×10⁶) were injected into lethally irradiated RAG2−/− mice i.v., and allowed to reconstitute for 6 wk.
Hematoxylin and eosin (H&E) staining
Lungs and livers were fixed in 10% neutral buffered formalin (SIGMA) for 24h and then transferred to a solution of 70% ethanol. Fixed tissue were embedded in paraffin and stained with hematoxylin and eosin by American Histolabs (Gaithersburg, MD).
IL-2 Capture Assay
Naíve (CD4+CD25−CD44lowCD62Lhigh) cells were sorted, and activated with plate-bound anti-CD3 and anti-CD28 (1μg) for 48 hours. IL-2 secretion was measured using the IL-2 Secretion assay kit (Miltenyi) according to manufacturer’s instructions.
Phospho-STAT5 staining
Naíve (CD4+CD25−CD44lowCD62Lhigh) cells were sorted, and activated with plate-bound anti-CD3 and anti-CD28 (1 μg/well) for 48 h. The cells were then washed and exogenous IL-2 (100, 10 and 1 U/ml) was added to the cells for 15 minutes. The cells were immediately fixed with Cytofix/Cytoperm buffer (BD). After incubation for 12 minutes, the cells were washed, resuspended in 1ml Perm Buffer II (BD), and incubated on ice for 30 minutes. After an additional wash, cells were stained with pSTAT5 (pY694; Cell Signaling Technology).
EAE induction
Mice were immunized subcutaneously in the flank with the myelin oligodendrocyte glycoprotein (MOG) peptide (400 μg, MEVGWYRSPFSRVVHLYRNGK) in CFA containing Mycobacterium tuberculosis strain H37Ra (400 μg, DIFCO). Pertussis toxin (200 ng/mouse, EMD) was injected i.v. on d 0 and 2. The following criteria were used to score mice: 0, no signs of disease; 1, complete tail paralysis; 2, hind limb paresis; 3, complete hind limb paralysis; 4, unilateral forelimb paralysis; and 5, moribund/death. Data presented are the mean clinical scores of five mice per group.
Statistical Analysis
All data are presented as the mean values ± SD. Comparisons between groups were analyzed using ANOVA with posthoc Tukey test (GraphPad Prism). Statistical significance was established at the levels of * P ≤ 0.05, **P ≤ 0.005, ***P ≤ 0.0005 and **** P ≤ 0.0001.
Results
Eos is preferentially expressed by Treg in the steady state, but is upregulated in Tconv cells upon activation
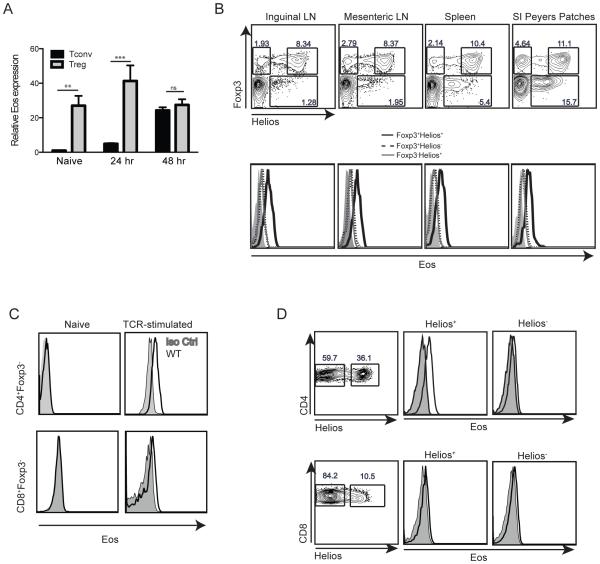
Previous studies have shown that expression of Eos was limited to Treg (6, 9). We first re-examined the expression of Eos both at the mRNA and protein levels in Treg and Tconv cells. Freshly explanted Treg expressed high levels of Eos mRNA when compared to other cells types (Tconv, F4/80+ cells, CD11b+ cells, and CD19+ cells) (Fig. 1A and Supplemental Fig. 1B). Activation of Treg with plate-bound anti-CD3 and anti-CD28 for 24 h increased Eos mRNA expression. Interestingly, activation of Tconv cells also resulted in upregulation of Eos mRNA after 24 and 48 h (Fig. 1A). At 48 h after activation, Treg and Tconv cells expressed similar levels of Eos mRNA. We utilized a commercially available anti-Eos mAb to carefully examine Eos protein expression in Treg subsets and in Tconv cells. Eos was highly expressed on Foxp3+Helios+ Treg, while Foxp3+Helios− cells from all lymphoid organs expressed much lower levels of Eos protein (Fig. 1B). Eos protein expression could not be detected in freshly isolated CD4+Foxp3− T cells or in CD8+Foxp3− T cells; however, when CD4+Foxp3− or CD8+Foxp3− T cells were activated in vitro for 72h, Eos could readily be detected (Fig. 1C). Although Eos could be detected on Tconv cells upon activation in vitro, Eos expression was not observed on CD4+CD44+ Tconv memory cells in naíve mice, (Supplemenatal Fig. 1C). However, low levels of Eos expression were observed on CD4+Foxp3−Helios+ T cells (Fig. 1B), a subset of Tconv cells with a very activated phenotype in vivo (A. Thornton et al, unpublished).
Figure 1.
Eos expression by Treg and Tconv cells. (A) Eos mRNA expression by naíve and activated Treg and Tconv. Treg (CD4+Foxp3-GFP+) and Tconv (CD4+Foxp3-GFP−CD44lowCD62Lhigh) were FACS-sorted and activated with plate bound anti-CD3 and anti-CD28 for the indicated times. (B) Eos protein expression by Foxp3+Helios+, Foxp3+Helios− and Foxp3−Helios+ cells in different immune organs. (C) Eos protein expression by activated Tconv cells. Splenocytes were activated with plate-bound anti-CD3 and anti-CD28 (1 μg/well) for 72 h. (D) Eos protein expression on freshly explanted Helios− and Helios+ CD4+ and CD8+ T cells in 21 d old scurfy mice.
We also studied Eos expression on Treg in combination with other phenotypic markers such as CD44, CD69, GITR, CD103 and Ki-67. Treg with high expression of CD44, CD69 and GITR expressed slightly higher levels of Eos, demonstrating that activation status may impact the expression of this transcription factor. No differences in Eos expression were detected when we compared CD103+ and CD103− Tregs or Ki-67+ and Ki-67− Tregs (Supplemental Fig. 1D). In addition, we examined Eos expression on CD4+ and CD8+ Tconv cells in the scurfy mouse that lacks Foxp3+ Treg. In this model of heightened activation status in vivo, CD4+Helios+ T cells expressed high levels of Eos when compared with CD4+Helios− T cells, demonstrating the presence of Eos in the absence of Foxp3+ Treg. Interestingly, CD8+ T cells from the scurfy mouse expressed very low levels of Eos regardless of their Helios expression (Fig. 1D). Lastly, we sorted human CD4+ Treg (CD25+CD127−) and Tconv cells (CD25−CD127+), and activated them in vitro with anti-CD3/CD28 coated beads for 2 weeks. Even though both cell populations expressed Eos, activated human Treg did have a higher Eos expression profile than activated human Tconv cells (Supplemental Fig. 1E).
Eos is expressed at high levels on in vitro induced, but minimally expressed on in vivo induced iTreg
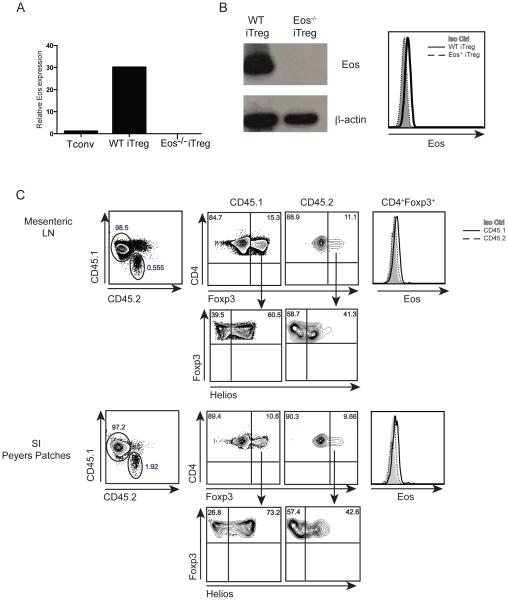
The enhanced expression of Eos on Helios+ Foxp3+ Treg compared to Helios− Foxp3+ Treg raised the possibility that Eos expression might be a marker for thymus-derived (t)Treg. To further explore this possibility, we first induced Treg by stimulating naíve CD4+Foxp3− T cells with anti-CD3/CD28 in the presence of TGF-β and IL-2 in vitro. Induced Treg (iTreg) expressed high levels of Eos when examined at the mRNA and at the protein level when examined by western blotting and by FACS analysis (Fig. 2A and 2B). Eos−/− naíve T cells differentiated into iTreg as well as WT naíve T cells (data not shown), and iTreg generated from naive Eos−/− Tcells were used as a negative control for these experiments.
Figure 2.
Eos expression by in vitro iTreg and invivo pTreg. Eos mRNA (A) and protein expression (B) by in vitro induced iTreg. CD4+Foxp3−GFP−CD44lowCD62Lhigh cells were activated with plate bound anti-CD3 and anti-CD28 (1 μg/well) in the presence of TGF-β (5 ng/ml) and IL-2 (100 U/ml) for 72 h. (C) Eos protein expression by in vivo induced pTreg. CD4+CD25−CD44lowCD45Rbhigh cells were sorted from OT-II (CD45.2) mice and were transferred into CD45.1 mice. Mice were fed 1.5% OVA water for 7 d, and Eos expression was measured on d 8 in the mesenteric lymph node and small intestine Peyers Patches.
We also examined Eos expression on peripherally induced Treg (pTreg) generated in vivo following oral tolerance. Naíve (CD4+CD25−CD44lowCD45RBhigh) WT OT-II cells (CD45.2), were transferred into congenically marked recipient mice (CD45.1). The mice were then fed 1.5% OVA water for 7 d, and induction of pTreg was measured on day 8 in the mesenteric lymph node and the small intestine Peyer’s Patches. The in vivo induced pTreg expressed low levels of Helios in the mesenteric lymph node and Peyers patches. Similarly, endogenous (CD45.1) CD4+Foxp3+ Treg expressed Eos, while the in vivo generated OT-II pTreg had barely detectable levels of Eos expression (Fig. 2C).
Eos−/− mice have normal numbers of Treg with a normal phenotype and normal suppressive capabilities in vitro
We examined the role of Eos in the function of Treg by utilizing Eos−/− mice. Eos−/− mice were generated by deleting exons 6, 7, and 8 resulting in a lack of expression of Eos mRNA and protein. The cellularity of the different immune organs in Eos−/− mice was comparable to WT mice (Supplemental Fig. 2A). In addition, Eos−/− mice had normal percentages of different immune cell types in the spleen with a slight reduction in CD19+ cells (Supplemental Fig. 2B). Complete blood count analysis demonstrated that Eos−/− mice had normal numbers of innate cells with a slight increase in polymorphonuclear leukocytes and monocytes (Supplemental Fig. 2C). Measurement of serum Ig levels was also comparable between WT and Eos−/− mice (Supplemental Fig. 2D).
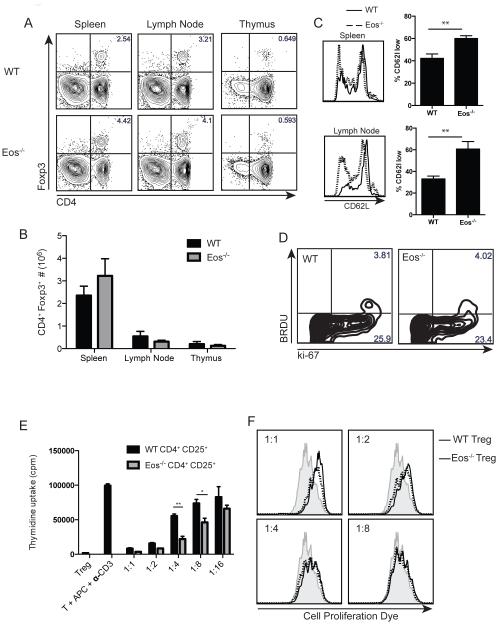
Given the high expression level of Eos in Treg, we studied the percentage and number of Treg in the spleen, lymph node and thymus of Eos−/− mice. When compared with WT mice, Eos−/− mice had similar percentages and absolute numbers of Treg in all the organs (Fig. 3A, B). The total number of Treg was slightly reduced in the lymph nodes, but the spleens of Eos−/− mice had slightly elevated numbers of Treg; however this was not statistically significant. This altered distribution can partly be explained by the reduced CD62L expression on Eos−/− Treg (Fig. 3C). We also checked other phenotypic markers such as CD25, CD44, CTLA-4, CD103, CD69, and did not detect any differences between WT and Eos−/− Treg (data not shown). BrdU incorporation after an overnight pulse and Ki-67 staining of splenocytes demonstrated that the homeostatic proliferation of Eos−/− Treg was also similar to that of WT Treg (Fig. 3D).
Figure 3.
Eos−/− mice have normal numbers of Treg with normal suppressive capacities in vitro. Percentage (A) and number (B) of CD4+Foxp3+ Treg in the spleen, lymph node and thymus of WT and Eos−/− mice. CD62L expression (C) and BrdU incorporation (D) by Treg in WT and Eos−/− mice. For measurement of homeostatic proliferation, BrdU (1 mg/mouse) was injected i.p., and the cells were harvested and stained with anti-BrdU and anti-ki67 24 h later. (E) In vitro suppressive capacity of WT and Eos−/− Treg. WT T effector cells (CD4+CD25−CD44lowCD62Lhigh, 5×10⁴) were activated with soluble anti-CD3 and irradiated T-depleted splenocytes (5×10⁴) either in the absence or presence of Treg (CD4+CD25+) from WT or Eos−/− mice for 3 d. Cultures were pulsed with [3H]-thymidine for the last 6 hours of the culture. (F) WT T effector cells (CD4+Foxp3-GFP−CD44lowCD62Lhigh, 5×10⁴) were labeled with cell proliferation dye and placed in culture with irradiated T-depleted splenocytes (5×10⁴) and soluble anti-CD3 either in the absence or presence of Treg (CD4+Foxp3-GFP+) from WT or Eos−/− mice. Dilution of cell proliferation dye was measured on day 3.
Next, we tested the suppressive capabilities of Eos−/− Treg in an in vitro suppression assay. In the 3H-thymidine incorporation assay, Eos−/− Treg (CD4+CD25+) suppressed WT T cell (CD4+CD25−CD62LhighCD44low) proliferation in a dose-dependent manner. In some cases (1:4 and 1:8 Treg:T cell ratios), Eos−/− Treg were more potent suppressors of TCR-driven proliferation than WT Treg (Fig. 3E). To more definitively study the suppressive capacity of Eos−/− Treg, we generated Eos−/−Foxp3-GFP mice, and sorted CD4+Foxp3− T cells and Foxp3-GFP+ Treg from these mice. Naíve WT CD4+ T cells (CD4+GFP− CD62LhighCD44low) were labeled with cell proliferation dye, and placed in co-culture with T-depleted splenocytes and soluble anti-CD3. In the absence of Treg, T cells proliferated effectively demonstrated by dilution of the cell proliferation dye. WT or Eos−/− Treg (CD4+Foxp3-GFP+) similarly suppressed T cell proliferation in a dose-dependent manner (Fig. 3F). We were unable to examine the suppressive capacity of either WT or Eos−/− Treg on CD4+Foxp3− T cells derived from Eos−/− mice secondary to the failure of the latter to proliferate in culture (see below).
Eos−/− Treg are fully competent suppressors in vivo in different models of autoimmune disease
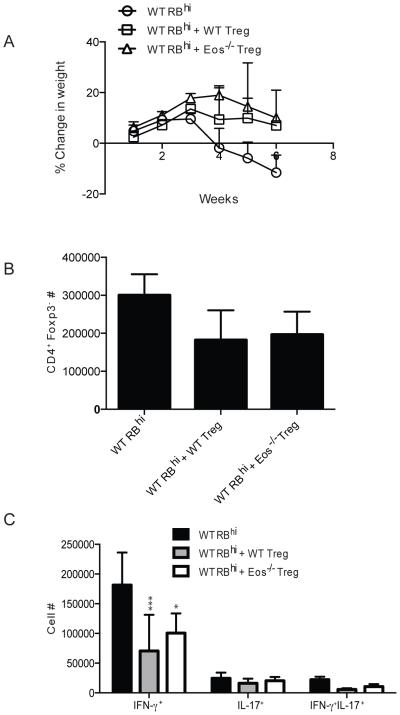
In order to test the suppressive ability of Eos−/− Treg in vivo, we utilized the adoptive transfer IBD model. In this study, naíve cells (CD4+Foxp3-GFP−CD44−CD45Rbhigh) were injected into RAG−/− recipient mice. In some groups, WT or Eos−/− Foxp3-GFP+ Treg were co-transferred with the WT naíve T cells. The mice that received the Teff cells alone started losing weight around week 4, and lost almost 20% of their initial weight by week 6. Co-transfer of WT or Eos−/− Treg reversed this weight loss, protecting the mice from wasting disease (Fig. 4A). The total number of CD4+Foxp3− detected in the mesenteric lymph nodes of the recipients was reduced to a similar level in mice that received either WT or Eos−/− Treg (Fig. 4B). The inflammatory process in this model is thought be driven by IFN-γ, and the number of IFN-γ+ and IFN-γ+IL-17+ cells was also reduced to similar levels in mice that received WT or Eos−/− Treg (Fig. 4C).
Figure 4.
Eos−/− Treg were suppressive in vivo in an IBD mouse model. (A) Weight loss in three different groups of mice. CD4+Foxp3-GFP−CD44lowCD45Rbhigh cells were sorted from WT mice and injected into RAG2−/− mice alone or in combination with CD4+Foxp3-GFP+ cells from WT or Eos−/− mice. (B) The number of CD4+Foxp3− and (C) the number of CD4+ cytokine (IFN-γ and IL-17) producing cells was calculated at the end of the study.
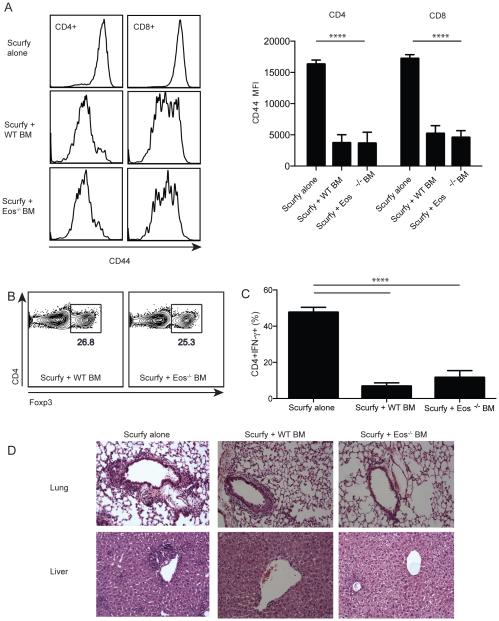
Next, we utilized a novel and highly sensitive system to test the suppressive capacity of Eos−/− Treg by generating mixed chimeras in irradiated RAG2−/− recipients using fetal liver cells from scurfy mice and WT or Eos−/− BM cells. Approximately six weeks after reconstitution, the recipients that received scurfy cells alone, developed systemic inflammation resembling the scurfy phenotype characterized by high levels of CD44 expression on both CD4+ and CD8+ T cells in the spleen. Co-transfer of congenically marked WT BM resulted in development of normal Tregs, and the reversal of CD44 upregulation on CD4+ and CD8+ cells in the spleen (Fig. 5A). Treg derived from Eos−/− BM developed normally and the percentage of Treg in the spleen was comparable to the group that received WT BM (Fig. 5B). Moreover, the Eos−/− Tregs were as effective as Treg derived from WT BM in reducing activation of CD4+ and CD8+ cells in the spleen (Fig. 5A). Both WT and Eos−/− Treg were equally effective in reducing IFN-γ secretion by activated CD4+ scurfy T cells (Fig. 5C). Lastly, transfer of scurfy fetal liver cells alone resulted in marked inflammation in the lungs and livers of the recipient mice and Tregs derived from either WT or Eos−/− BM were equally effective in controlling this inflammatory response (Fig. 5D). Taken together, these in vitro and in vivo studies have failed to define any deficiency in the suppressive function of Tregs derived from mice with a global deficiency of Eos.
Figure 5.
Eos−/− Treg were suppressive in vivo in a scurfy BM chimera model. (A) Scurfy fetal liver cells (CD45.1, 2.5×10⁵) were transferred into irradiated RAG2−/− mice alone or in combination with WT or Eos−/− BM cells (CD45.2, 1×10⁶). CD44 expression was measured on transferred CD45.1+ scurfy cells. (B) Percentage of CD4+Foxp3+ cells in the spleen of mice that received WT or Eos−/− BM. (C) Percentage of CD45.2+CD4+IFN-γ+ cells in the spleen of mice. (D) H&E sections of lung and liver from the three different groups of mice.
Eos−/− CD4+ Tconv cells secrete reduced amounts of IL-2 after TCR activation
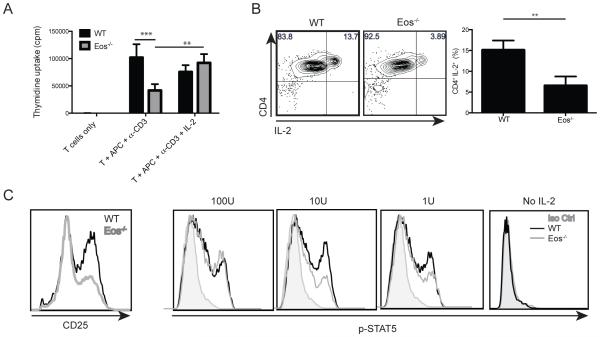
Since Eos was expressed in activated T cells, we also tested whether Eos played a role in the proliferation or differentiation of Tconv cells. CD4+ Eos−/− Tconv cells proliferated less vigorously than their WT counterpart when stimulated in vitro with soluble anti-CD3 and APC. Addition of exogenous IL-2 reversed this defect, suggesting that defective proliferative response of the Eos−/− Tconv cells was secondary to deficiency in IL-2 production (Fig. 6A). We then performed an IL-2 capture assay, which indicated that fewer Eos−/− CD4+ cells were secreting IL-2 48 hours after activation with plate-bound anti-CD3 and anti-CD28 (Fig 6B). In line with this observation, 48 hours after activation, Eos−/− Tconv cells had reduced levels of CD25 expression (Fig. 6C). This defect in CD25 upregulation translated into reduced pSTAT5 levels in the Eos−/− Tconv cells when the activated T cells were restimulated with 10U and 1U of exogenous IL-2 (Fig. 6C). Therefore, Eos−/− Tconv cells produced reduced amounts of IL-2, and failed to upregulate CD25 resulting in reduced proliferation in vitro.
Figure 6.
Eos−/− CD4+ Tconv cells proliferate less effectively due to a defect in IL-2 production. (A) Naíve WT T cells (CD4+CD25−CD44lowCD62Lhigh, 5×10⁴) were activated with soluble anti-CD3 and irradiated T-depleted splenocytes (5×10⁴) and cultured for 72 h [3H]-thymidine was added in the last 6 h of culture. (B) IL-2 secretion by activated WT and Eos−/− CD4+ Tconv cells. Naíve (CD4+CD25−CD44lowCD62Lhigh) cells were sorted, and activated with plate-bound anti-CD3 and anti-CD28 (1 μg/well) for 48 h. (C) CD25 expression by activated CD4+ Tconv cells. Cells were sorted and activated as in (B). After 48 h of culture, the cells were stained for CD25 expression. Exogenous IL-2 was added to aliquots of the activated cells and p-STAT5 levels were measured.
Eos−/− mice develop more severe EAE when compared with WT mice
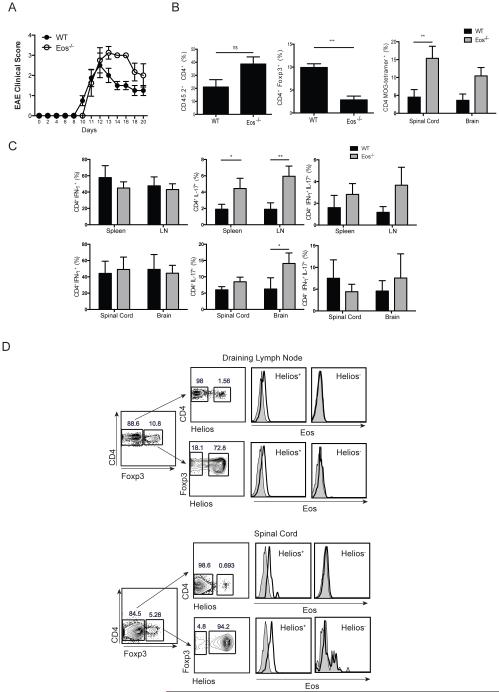
In order to evaluate the capacity of Eos−/− Tconv cells to differentiate into Teff cells in vivo, we first compared the susceptibility of Eos−/− and WT mice to the development of EAE induced by immunization with MOG35-55 in CFA. Initially, the disease course for both groups was similar with mice starting to develop paralysis on day 12. However, Eos−/− mice developed more severe EAE, and could not recover from paralysis with some mice succumbing to death (Fig. 7A). The spinal cord of Eos−/− mice contained a higher percentage of CD4+Foxp3− and a lower percentage of CD4+Foxp3+ T cells than spinal cords derived from WT mice. In addition, the spinal cords and brains of Eos−/− mice had higher percentage of MOG-specific cells as detected by tetramer binding, partly explaining the enhanced disease severity in these mice (Fig. 7B). A significant increase in CD4+IL-17+ cells was observed in spleen, lymph node and brain of Eos−/− mice when compared with WT mice (Fig. 7C), while there was no difference in CD4+IFN-γ+ cells. Taking into consideration that Eos−/− mice had higher overall percentage of CD4+ T cells, the pathogenic cytokines in the CNS of Eos−/− mice were highly increased. It was also of interest to examine Eos expression in WT mice with EAE. Surprisingly, for both Tconv and Treg populations, CD4+Helios+ cells expressed Eos, while CD4+Helios− cells did not express Eos in either the draining lymph nodes or the spinal cord (Fig. 7D).
Figure 7.
Eos−/− mice develop more severe EAE. (A) Clinical score of EAE in WT and Eos−/− mice. Mice were immunized with MOG/CFA and injected with pertussis toxin on day 0 and 2. (B) Percentage of CD4+, CD4+Foxp3+, and CD4+ MOG-Tetramer+ cells in the CNS on d 12. (C) Percentage of IFN-γ+, IL-17+ and double positive cells in the spleen, draining lymph node, spinal cord and brain of WT and Eos−/− mice on d 12. The cells were harvested, and stimulated with PMA/Ionomycin for 4 h before measurement of cytokine production. (D) Eos staining in the draining lymph node and spinal cord of WT mice with EAE on day 12.
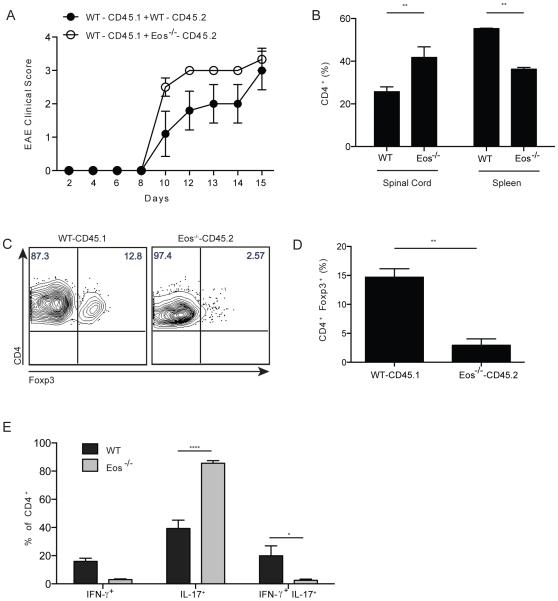
To determine if the enhanced susceptibility of the Eos−/− mice to develop EAE was T cell intrinsic, we generated mixed chimeras in sublethally irradiated RAG2−/− mice with WT (CD45.1) and either WT BM (CD45.2) or Eos−/− BM (CD45.2) cells. After 6 weeks, WT and Eos−/− cells equally reconstituted the mice (Supplemental Fig. 3). Both WT/WT and WT/Eos−/− chimeras developed EAE very rapidly, and most of the mice succumbed to death within 15 d. WT/Eos−/− chimeras had slightly higher disease scores on day 10, but the scores were comparable to the WT/WT chimeras by day 15 (Fig. 8A). In the spinal cords of WT/Eos−/− chimeras, a higher percentage of CD4+ T cells were derived from the Eos−/− donor accompanied by a decrease in the percentages of Eos−/− CD4+ cells in the spleen (Fig. 8B). There were significantly fewer Treg from the Eos−/− donor in the spinal cord of the mixed chimeras (Fig. 8C). Moreover, a higher percentage of Eos−/− CD4+Foxp3− T cells were exclusively secreting IL-17, with a reduction in single IFN-γ and double positive (IFN-γ and IL-17) cells (Fig. 8D). These results are consistent with a T cell intrinsic enhancement of the differentiation of Th17 cells in the absence of Eos expression.
Figure 8.
Eos−/− CD4+ T cells secrete high amounts of IL-17 in the CNS of chimeric mice. (A) Clinical score of EAE in chimeric mice. BM chimeras were generated (WT+WT, and WT+Eos−/−) using congenic markers, and 6 wk after reconstitution, EAE was induced in mice as in Fig. 7. (B) Percentage of CD4+ T cells in the spinal cord and spleen of chimeric mice. (C) and (D) Percentage of CD4+Foxp3+ Treg in the CNS of chimeric mice. (E) Percentage of IFN-γ+, IL-17+ and double positive cells in the spinal cord of chimeric mice.
Discussion
In this report, we have examined in depth the expression and function of Eos in the immune system. Our studies were facilitated by the availability of a mouse with a global deficiency of Eos and a mAb that specifically recognized T cells from WT mice, but was completely non-reactive with T cells from the Eos−/− mouse. Previous studies that have examined Eos expression in T lymphocytes have utilized polyclonal anti-peptide antibodies and the specificity of these reagents was not adequately documented (6, 9, 10). Careful examination of Eos expression showed that Eos was not an exclusive marker for Treg, and that activated Tconv cells also expressed Eos. Recently, Campos-Mora et al. (11) also showed that Eos was expressed on activated CD4+Foxp3− cells in the context of a murine skin transplantation model. In our studies, although almost all Foxp3+ Treg were reactive with the anti-Eos mAb, the subpopulation of Foxp3+ Helios+ Treg expressed much higher levels of Eos than the Foxp3+Helios− subpopulation. As we have previously proposed that Helios expression is a marker for tTreg, we examined the expression of Eos on both iTreg and pTreg (12). While iTreg expressed high levels of Eos, pTreg expressed barely detectable levels of Eos and very low levels of Helios. As in vivo generated pTreg, in contrast to in vitro generated iTreg, are regarded as similar to tTreg (7), the functional role of the Foxp3+HelioslowEoslow pTregs induced by oral antigen and their counterparts in normal mice is worthy of further study.
Eos has been characterized in bioinformatics studies as one of a unique group of Treg signature genes (including IRF4, Satb1, Lef1 and GATA-1) that can act in concert with Foxp3 to activate most of the Treg signature (8). However, deletion of Eos or any one member of this group of transcription factors was not sufficient to change the gene signature of Treg. A critical role of Eos in Treg function was first proposed by Pan et al (6) who demonstrated that Eos was preferentially expressed in Treg when compared to other non-activated T cells and formed complexes with Foxp3 and CtBP1 that functioned by silencing IL-2 production in Treg. Ablation of Eos expression in Treg by using a specific siRNA changed their phenotype into an effector-like phenotype in which Treg secreted IFN-γ and IL-2. Expression of the Eos siRNA also abrogated the in vitro suppressor function of Tconv cells that were transfected with Foxp3. Interestingly, when Eos-deleted Treg were used in IBD studies in vivo, these cells were not protective and appeared to have converted to effector cells resulting in wasting disease in the recipient mice. In contrast to the studies of Pan et al (6), we were unable to demonstrate any defect in the in vitro suppressor capacity of highly purified Treg from the Eos−/− mice. It remains possible that the siRNA approach may allow expression of dominant negative proteins that include exon 8 encoded sequences, but lack upstream domains. Furthermore, Treg from the Eos−/− mice were just as suppressive as Treg from WT mice in the IBD model. Lastly, we also demonstrated normal suppressor function for Eos−/− Treg in a chimera model in which irradiated recipients were reconstituted with scurfy fetal liver together with BM from either WT or Eos−/− BM. In our experience (13), this chimera model is highly sensitive in detecting even partial defects in Treg suppressor function. Thus, we conclude that expression of Eos is not required for either the in vitro or in vivo suppressive functions of Treg. It should be noted that within the Eos global knockout mice, there may be compensatory mechanisms at play in Treg; however, a clear defect in Tconv cells is evident. These results again differ from the siRNA knock down experiments in which 90% of the genes suppressed by Foxp3 were no longer down regulated after the siRNA knockdown.
The promoters of several genes (IL2ra, CTLA4, Tnfrsf18, lkzf2 [encoding Helios] and lkzf4 [encoding Eos]) have been shown to be hypomethylated in tTreg and it is likely that hypomethylation is related to the stability of expression of these genes in tTreg (7). However, Sharma et al (9) have recently demonstrated a major subpopulation (~50%) of Treg undergo loss of Treg function and conversion to a T effector/helper phenotype (expressing CD40L, and producing IL-2 and IL-17) under certain inflammatory conditions (exposure to incomplete Freund’s adjuvant and CpG) or when briefly cultured with cycloheximide. The converted cells down regulated expression of Eos, but not Foxp3. Although we did not repeat these studies, our in vivo experiments in the IBD model or in the scurfy chimera model (both inflammatory models) did not reveal any abnormalities of Treg suppressor function or instability. Further studies with mice expressing a Treg conditional deletion of Eos may help resolve these differences.
In contrast to our failure to uncover any abnormalities in Treg function in Eos−/− mice, CD4+ Tconv cells in these mice displayed a dramatic phenotype in vitro in that they had a markedly diminished proliferative response to polyclonal T cell stimulation, a marked defect in IL-2 production, and a failure to up-regulate CD25. All of these abnormalities could be restored by the addition of exogenous IL-2 to the cultures. Although IL-2 has a critical role in the expansion of CD8+ T cells in vivo (14), its contribution to the growth and differentiation of CD4+ cells is much less well defined (15). We considered the possibility that Eos−/− mice might be resistant to the induction of autoimmune disease secondary to the failure to expand autoantigen-specific CD4+ T cells. Surprisingly, we observed that Eos−/− mice had an enhanced susceptibility to the induction of EAE accompanied by heightened Th17 differentiation and an increase in autoantigen-specific T cells. The enhanced Th17 response was CD4+ T cell intrinsic and most likely secondary to the decreased capacity of CD4+ T cells from Eos−/− mice to secrete IL-2, a well-characterized inhibitor of Th17 differentiation (16). While our studies show that there is a correlation between reduced IL-2 production by Eos−/− T conv cells in vitro and an increased IL-17 production during EAE in vivo, a direct effect has not been established. In addition, we cannot rule out the possibility that a defective IL-2 response in vivo may result in reduced Treg activity in vivo during EAE. The role of Eos in Th17 differentiation has also been implicated in studies demonstrating that miR-17 enhances Th17 polarization by inhibiting Eos expression (17, 18). Mice that lacked miR17-92 in their T cells developed less severe EAE, due to increased Eos and a subsequent reduced IL-17 production.
Other members of the Ikaros gene family also have been shown to play a role in Th17 differentiation. Quintana et al (19) showed that Th17 cells expressed high levels of Aiolos mRNA, and that the binding of the Aryl hydrocarbon receptor (AhR) and STAT3 in the Aiolos promoter resulted in increased Aiolos expression. Interaction of Aiolos on the IL-2 promoter resulted in reduced IL-2 production and subsequent increase in IL-17 production. In this study, Th17 cells expressed very low levels of Eos suggesting that down regulation of Eos is required for IL-17 production. While Eos and Aiolos are in the same family of transcription factors and both play a role in Th17 differentiation, they mediated their effects by different pathways in that Eos promotes IL-2 production, while Aiolos suppresses IL-2 production.
In conclusion, we report that Eos appears to play no role in Treg function, but is a member of a transcriptional network that regulates IL-2 and IL-17 production in activated CD4+ Tconv cells. In activated T cells in the spinal cord in mice with EAE, Eos and Helios appear to be co-expressed by a very small subset of activated cells that may represent antigen-specific Tconv cells. We have not yet determined the direct nuclear targets of Eos. It remains possible that Eos in a manner similar to other Ikaros family members binds to the IL-2 promoter, but functions as a transcriptional activator. It is also possible that it functions as a transcriptional repressor for a gene that plays a negative role in the activation of IL-2 production. Nonetheless, our studies in the EAE model demonstrate that Eos plays a highly significant role in Th17 differentiation.
Supplementary Material
Acknowledgments
We thank Britany Bowen for providing the human Treg and human T conv cells. In addition, we thank the FACS Core facility for FACS sorting, and the members of Shevach and Paul lab for helpful discussions.
This work was supported by the Intramural Program of the National Institute of Allergy and Infectious Diseases
Abbreviations used in this article
- BM
bone marrow
- deficient (−/−)
- EAE
experimental autoimmune encephalomyelitis
- IBD
inflammatory bowel disease
- Tconv
T conventional cells
- Teff
Teffector cells
- Treg
T regulatory cells
- WT
wild type
Footnotes
Disclosures
The authors have no financial conflicts of interest.
References
- 1.Honma Y, Kiyosawa H, Mori T, Oguri A, Nikaido T, Kanazawa K, Tojo M, Takeda J, Tanno Y, Yokoya S, Kawabata I, Ikeda H, Wanaka A. Eos: a novel member of the Ikaros gene family expressed predominantly in the developing nervous system. FEBS Lett. 1999;447:76–80. doi: 10.1016/s0014-5793(99)00265-3. [DOI] [PubMed] [Google Scholar]
- 2.John LB, Yoong S, Ward AC. Evolution of the Ikaros gene family: implications for the origins of adaptive immunity. J. Immunol. 2009;182:4792–4799. doi: 10.4049/jimmunol.0802372. [DOI] [PubMed] [Google Scholar]
- 3.John LB, Ward AC. The Ikaros gene family: transcriptional regulators of hematopoiesis and immunity. Mol. Immunol. 2011;48:1272–1278. doi: 10.1016/j.molimm.2011.03.006. [DOI] [PubMed] [Google Scholar]
- 4.Perdomo J, Holmes M, Chong B, Crossley M. Eos and pegasus, two members of the Ikaros family of proteins with distinct DNA binding activities. J. Biol. Chem. 2000;275:38347–38354. doi: 10.1074/jbc.M005457200. [DOI] [PubMed] [Google Scholar]
- 5.Bao J, Lin H, Ouyang Y, Lei D, Osman A, Kim TW, Mei L, Dai P, Ohlemiller KK, Ambron RT. Activity-dependent transcription regulation of PSD-95 by neuregulin-1 and Eos. Nat. Neurosci. 2004;7:1250–1258. doi: 10.1038/nn1342. [DOI] [PubMed] [Google Scholar]
- 6.Pan F, Yu H, Dang EV, Barbi J, Pan X, Grosso JF, Jinasena D, Sharma SM, McCadden EM, Getnet D, Drake CG, Liu JO, Ostrowski MC, Pardoll DM. Eos mediates Foxp3-dependent gene silencing in CD4+ regulatory T cells. Science. 2009;325:1142–1146. doi: 10.1126/science.1176077. [DOI] [PMC free article] [PubMed] [Google Scholar]
- 7.Ohkura N, Hamaguchi M, Morikawa H, Sugimura K, Tanaka A, Ito Y, Osaki M, Tanaka Y, Yamashita R, Nakano N, Huehn J, Fehling HJ, Sparwasser T, Nakai K, Sakaguchi S. T cell receptor stimulation-induced epigenetic changes and Foxp3 expression are independent and complementary events required for Treg cell development. Immunity. 2012;37:785–799. doi: 10.1016/j.immuni.2012.09.010. [DOI] [PubMed] [Google Scholar]
- 8.Fu W, Ergun A, Lu T, Hill JA, Haxhinasto S, Fassett MS, Gazit R, Adoro S, Glimcher L, Chan S, Kastner P, Rossi D, Collins JJ, Mathis D, Benoist C. A multiply redundant genetic switch 'locks in' the transcriptional signature of regulatory T cells. Nature Immunol. 2012;13:972–980. doi: 10.1038/ni.2420. [DOI] [PMC free article] [PubMed] [Google Scholar]
- 9.Sharma MD, Huang L, Choi JH, Lee EJ, Wilson JM, Lemos H, Pan F, Blazar BR, Pardoll DM, Mellor AL, Shi H, Munn DH. An inherently bifunctional subset of Foxp3+ T helper cells is controlled by the transcription factor eos. Immunity. 2013;38:998–1012. doi: 10.1016/j.immuni.2013.01.013. [DOI] [PMC free article] [PubMed] [Google Scholar]
- 10.Bettini ML, Pan F, Bettini M, Finkelstein D, Rehg JE, Floess S, Bell BD, Ziegler SF, Huehn J, Pardoll DM, Vignali DA. Loss of epigenetic modification driven by the Foxp3 transcription factor leads to regulatory T cell insufficiency. Immunity. 2012;36:717–730. doi: 10.1016/j.immuni.2012.03.020. [DOI] [PMC free article] [PubMed] [Google Scholar]
- 11.Campos-Mora M, Morales RA, Perez F, Gajardo T, Campos J, Catalan D, Aguillon JC, Pino-Lagos K. Neuropilin-1+ regulatory T cells promote skin allograft survival and modulate effector CD4 T cells phenotypic signature. Immunol. Cell. Biol. 2014;93:113–119. doi: 10.1038/icb.2014.77. [DOI] [PubMed] [Google Scholar]
- 12.Thornton AM, Korty PE, Tran DQ, Wohlfert EA, Murray PE, Belkaid Y, Shevach EM. Expression of Helios, an Ikaros transcription factor family member, differentiates thymic-derived from peripherally induced Foxp3+ T regulatory cells. J. Immunol. 2010;184:3433–3441. doi: 10.4049/jimmunol.0904028. [DOI] [PMC free article] [PubMed] [Google Scholar]
- 13.Metidji A, Glass S.A. Rieder, D.C., Cremer I, Punkosdy GA, Shevach EM. IFNα/βR signaling promotes regulatory T cell development and function under stress conditions. J. Immunol. 2015 doi: 10.4049/jimmunol.1500036. In Press. [DOI] [PMC free article] [PubMed] [Google Scholar]
- 14.Kamimura D, Bevan MJ. Naive CD8+ T cells differentiate into protective memory-like cells after IL-2 anti IL-2 complex treatment in vivo. J. Exp. Med. 2007;204:1803–1812. doi: 10.1084/jem.20070543. [DOI] [PMC free article] [PubMed] [Google Scholar]
- 15.Stephens GL, McHugh RS, Whitters MJ, Young DA, Luxenberg D, Carreno BM, Collins M, Shevach EM. Engagement of glucocorticoid-induced TNFR family-related receptor on effector T cells by its ligand mediates resistance to suppression by CD4+CD25+ T cells. J. Immunol. 2004;173:5008–5020. doi: 10.4049/jimmunol.173.8.5008. [DOI] [PubMed] [Google Scholar]
- 16.Laurence A, Tato CM, Davidson TS, Kanno Y, Chen Z, Yao Z, Blank RB, Meylan F, Siegel R, Hennighausen L, Shevach EM, O'Shea J. Interleukin-2 signaling via STAT5 constrains T helper 17 cell generation. Immunity. 2007;26:371–381. doi: 10.1016/j.immuni.2007.02.009. J. [DOI] [PubMed] [Google Scholar]
- 17.Liu SQ, Jiang S, Li C, Zhang B, Li QJ. miR-17-92 cluster targets phosphatase and tensin homology and Ikaros Family Zinc Finger 4 to promote TH17-mediated inflammation. J. Biol. Chem. 2014;289:12446–12456. doi: 10.1074/jbc.M114.550723. [DOI] [PMC free article] [PubMed] [Google Scholar]
- 18.Yosef N, Shalek AK, Gaublomme JT, Jin H, Lee Y, Awasthi A, Wu C, Karwacz K, Xiao S, Jorgolli M, Gennert D, Satija R, Shakya A, Lu DY, Trombetta JJ, Pillai MR, Ratcliffe PJ, Coleman ML, Bix M, Tantin D, Park H, Kuchroo VK, Regev A. Dynamic regulatory network controlling TH17 cell differentiation. Nature. 2013;496:461–468. doi: 10.1038/nature11981. [DOI] [PMC free article] [PubMed] [Google Scholar]
- 19.Quintana FJ, Jin H, Burns EJ, Nadeau M, Yeste A, Kumar D, Rangachari M, Zhu C, Xiao S, Seavitt J, Georgopoulos K, Kuchroo VK. Aiolos promotes TH17 differentiation by directly silencing Il2 expression. Nat. Immunol. 2012;13:770–777. doi: 10.1038/ni.2363. [DOI] [PMC free article] [PubMed] [Google Scholar]
Associated Data
This section collects any data citations, data availability statements, or supplementary materials included in this article.


