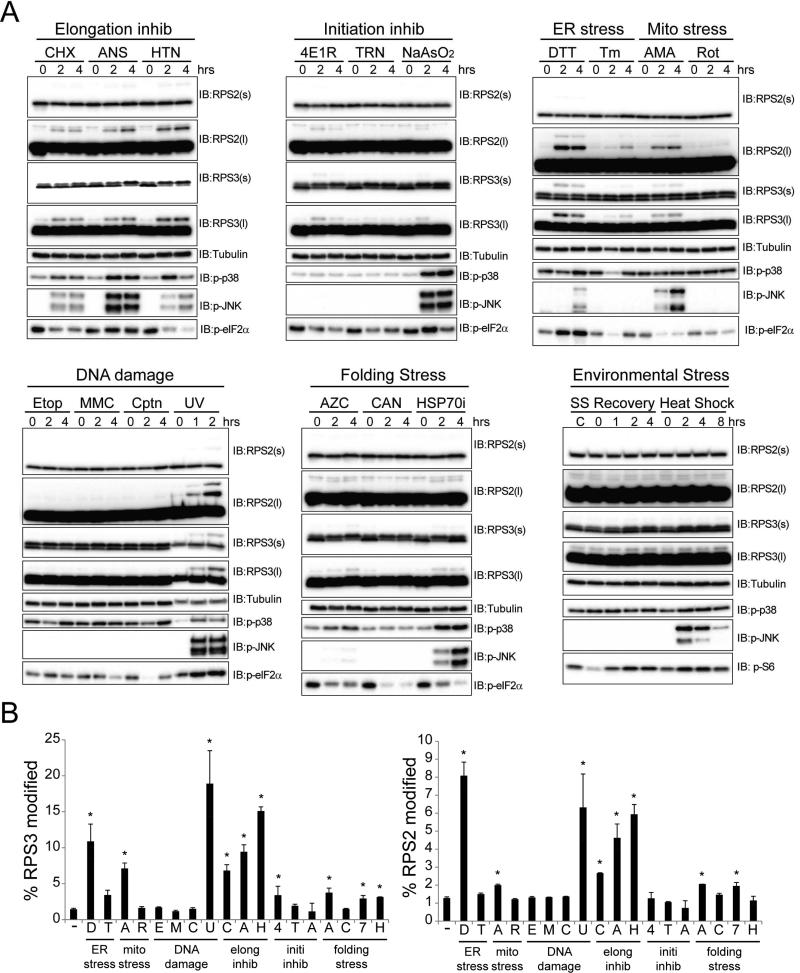
Figure 3. Regulatory RPS2 and RPS3 ubiquitylation is induced by diverse but specific cell stressors.
A) HCT116 cells were treated with a panel of cellular stressors. Whole cell lysates were analyzed by SDS-PAGE and immunoblotted with the indicated antibodies. (s) and (l) denote short and long exposures, respectively.
B) Quantification of the percent RPS3 (left) or RPS2 (right) that is ub-modified from untreated cells or cells treated with the indicated cellular stressor. Error bars represent SEM from combined time course treatments for each cellular stressor. * indicates a p-value of < 0.05 comparing untreated cells to the combined time points for each cell stressor using Student's t-test. ER stress – DTT (D), Tunicamycin (Tm, T); Mitochondrial Stress – Antimycin A (AMA, A), Rotenone (Rot, R); Translation inhibitors – Cycloheximide (CHX, C), Anisomycin (ANS, A), Harringtonine (HTN, H); Translation initiation inhibitors – 4E1RCat (4E1R, 4), Torin-1 (TRN, T), Sodium Arsenite (NaAsO2, A); DNA damage inducers – Etoposide (Etop, E), Mitomycin-C (MMC, M), Cisplatin (Cptn, C), UV (U); Protein folding stressors – Azetidine-2-carboxylic acid (AZC, A), Canavanine (CAN, C), Pifithrin-μ (HSP70i, 7), Exposure to 42°C (Heat shock, H), Serum starvation overnight followed by re-addition of full media (SS Recovery).
See also Figure S3

