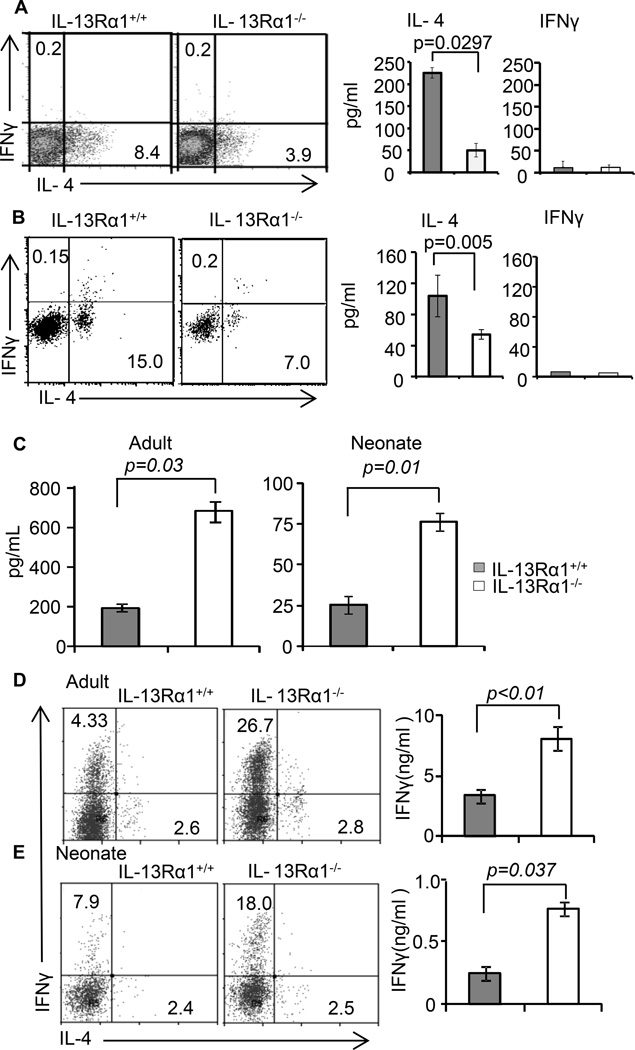
Figure 6.
IL-13Rα1 controls antigen presentation and T cell programing function of neonatal basophils and DCs. (A) Shows in vitro Ag presentation and the consequent T cell differentiation driven by OVAp-loaded IL-13Rα1+/+ or IL-13Rα1−/− BM-derived basophils as measured by cytokine production. The dot plots show intracellular cytokines while the bar graphs show cytokine secretion in culture supernatant. (B) MHC-II deficient adult Balb/c mice recipient of neonatal DO11.10 CD4+ T cells were given bone marrow-derived basophils from IL-13Rα1+/+ or IL-13Rα1−/− neonatal mice and the hosts were immunized with Ig-OVA. On day 14 the SP cells were stimulated with PMA and Ionomycin and cytokine production was measured by intracellular staining (left panel) and ELISA (right panel). The dot plots show intracellular cytokine production by DO11.10 T cells. The bar graphs show cytokine secretion in culture supernatant from mice recipient of IL-13Rα1+/+ (closed bars) or IL-13Rα1−/− (open bars) bone marrow-derived basophils. (C) Shows IL-12 production by DCs from IL-13Rα1−/− and IL-13Rα1+/+ neonatal and adult mice upon in vitro stimulation with LPS. (D and E) Show differentiation of naïve DO11.10 T cells into Th1 (IFNγ) and Th2 (IL-4) upon stimulation with OVAp-loaded DCs from adult (D) and neonatal (E) IL-13Rα1−/− and IL-13Rα1+/+ mice as measured by intracellular staining (dot plots) and ELISA (bar graphs). Each bar represents the mean ± SD of triplicate wells. Data are representative of 2 experiments.

