Figure 3.

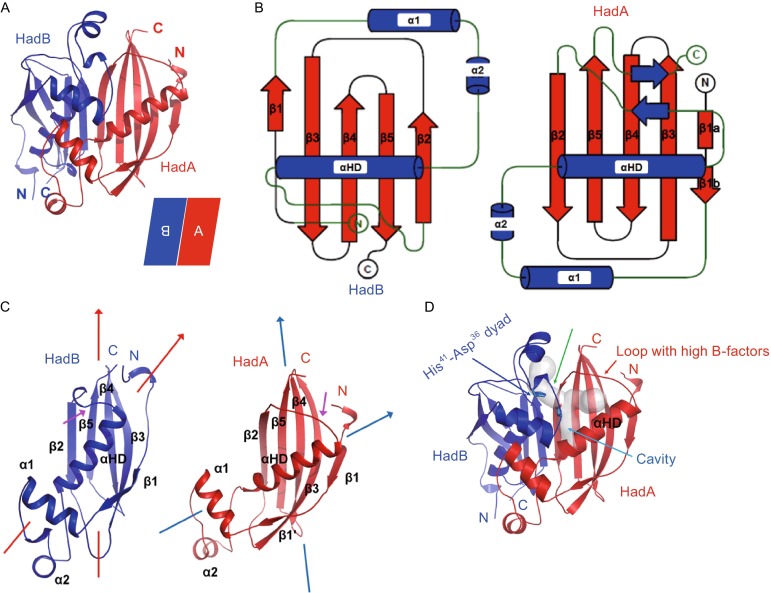
Overall structure of Mtb HadAB complex. (A) Cartoon representation of the structure of MtbHadAB hetero-dimer is shown. HadA (red color) sits antiparallel to HadB (blue color). (B) Topology diagram of the structure of HadA and HadB. A short pair of strands in HadA was undefined in the native structure because of poor density. (C) Differences in positioning of αHD of HadA and HadB are shown. Direction of the axis of the β-sheet w.r.t. αHD is shown with arrows. Difference in conformation of loop connecting β2 with αHD is pointed using a magenta colored arrow. (D) Location of pockets in the active site of HadB is shown. The fatty acid binding channel and a vertical cavity traversing the fatty acid binding channel is shown in grey colored transparent surface representation. Location of catalytic dyad, His41-Asp36, is shown. Cavities were identified using CAVER software
