Figure 6.
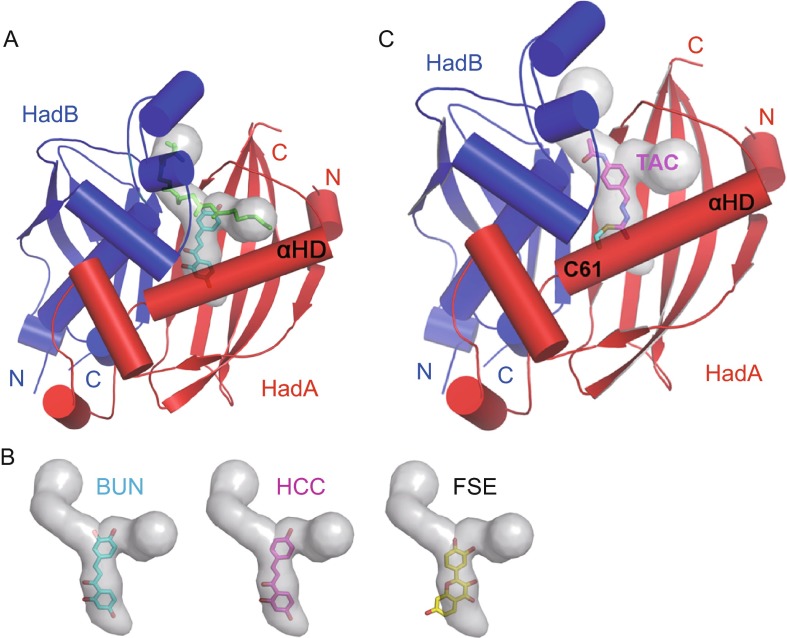
Mechanism of inhibition of enzymatic activity of Mtb HadAB complex. (A) Flavonoids bind in the cavity (gray colored surface representation) that traverses the fatty acid binding channel. An example of how binding of butein (cyan sticks) physically obstructs the placement of fatty acid (modeled as green sticks) in the substrate binding channel is shown. (B) All the three flavonoids (sticks) protrude into the substrate binding channel and perturb binding of the substrate in the active site. The cavity and substrate binding channel are shown as gray colored surface representation. (C) The inhibition model of thiacetazone (TAC, modeled as sticks) on MtbHadAB. TAC is shown covalently attached to Cys61 (shown as cyan colored sticks). C61S mutation is known to confer resistance to TAC. The drug protrudes into the fatty acid binding channel (gray colored surface representation) and occludes binding of fatty acid

