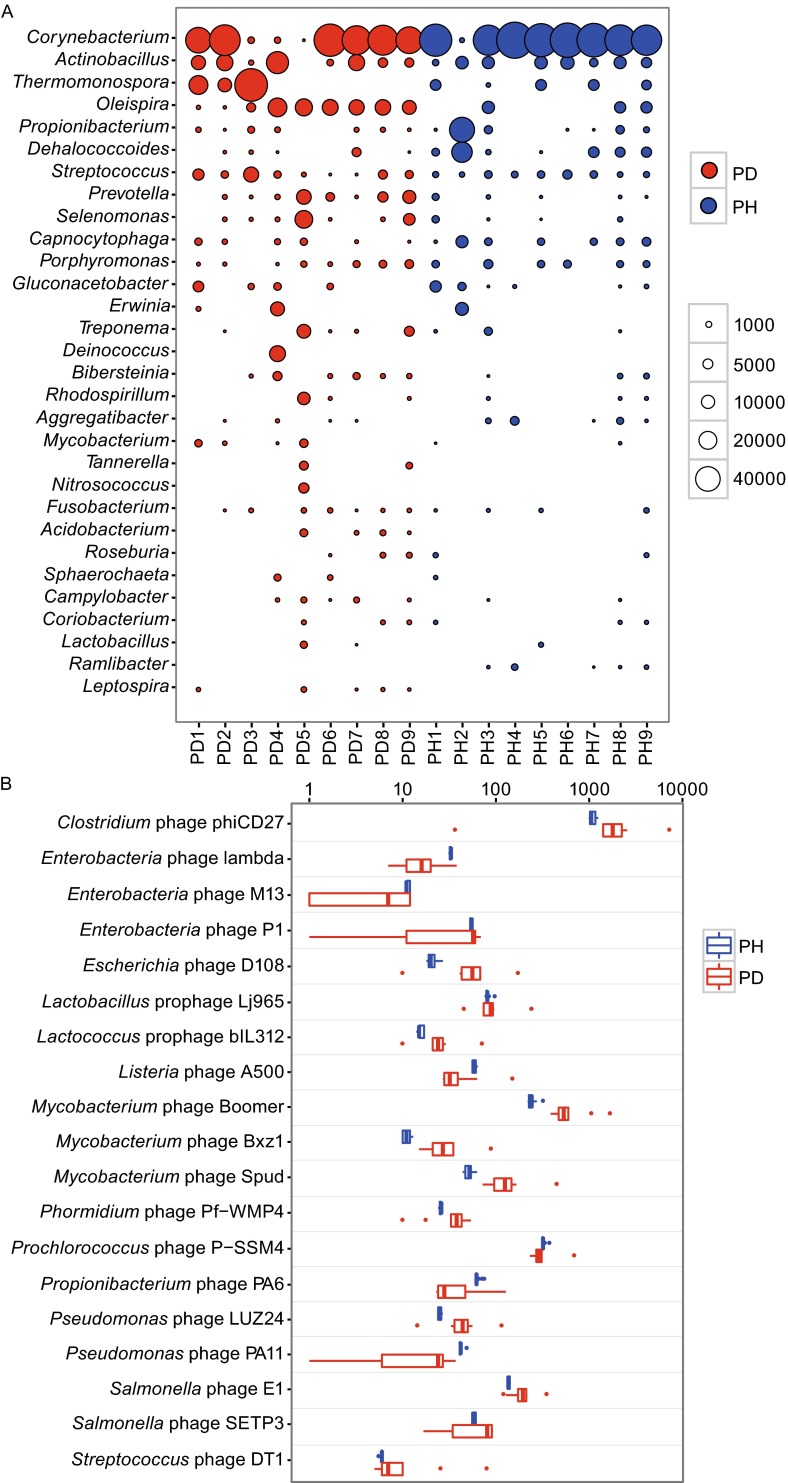
Figure 2.
Evenness of the CRISPR DRs and spacers in PD and PH samples. (A) Top 30 most abundant bacterial genera of DR source. Area of each bubble represented the relative abundance (by dividing total reads numbers of each sample and then normalized to 100,000) of DRs for each sample (column) and each genus (row). Red color represented PD (n = 9) and blue color represented the PH (n = 9) samples. (B) The most variegated spacers (classified to phage species by BLASTX) between the PD and PH groups (n = 9). Scales on x-axis represent relative abundance.

