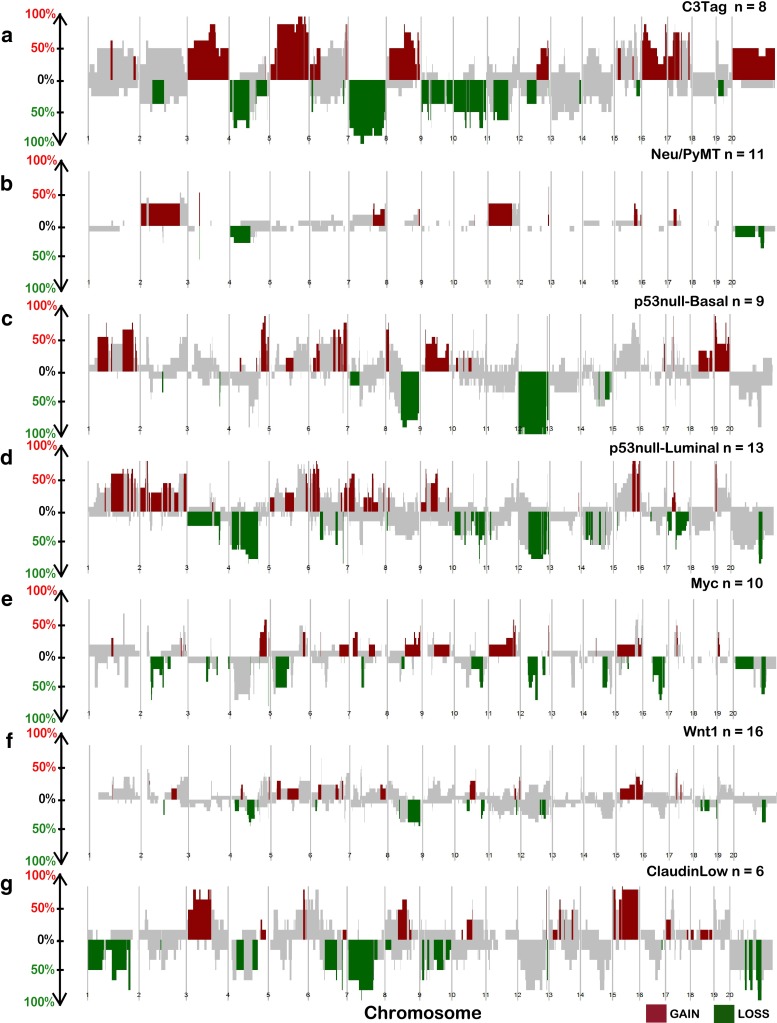
Fig. 2.
Copy number frequency landscape plots from SWITCHplus showing mouse group-specific CNAs. Segments of group-specific copy number gains are plotted above the x-axis in red and segments of copy number loss are plotted below the x-axis in green. Regions shaded gray indicate segments that are not group-specific or highly frequent (greater than or equal to 15 %). The frequency of alterations in each mouse group is indicated on the y-axis from 0 to 100 %. a C3Tag, b Neu/PyMT, c p53null-Basal, d p53null-Luminal, e Myc, f Wnt1, and g Claudin-Low copy number landscapes

