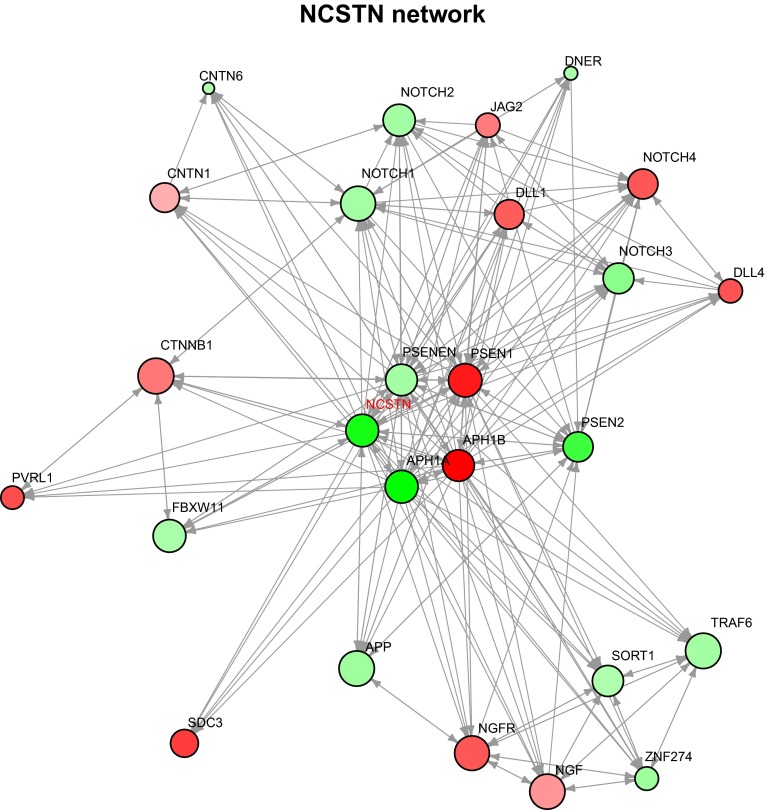
Fig. 4.
DawnRank identified NCSTN gene expression network. The plot represents the local neighborhood of NCSTN and all direct genes downstream. The green and red colors represent whether the gene is up-regulated or down-regulated, respectively. The intensity of the color represents the magnitude of gene expression change. The size of each node indicates the DawnRank score of that gene, representing the gene’s impact on downstream expression changes in the network

