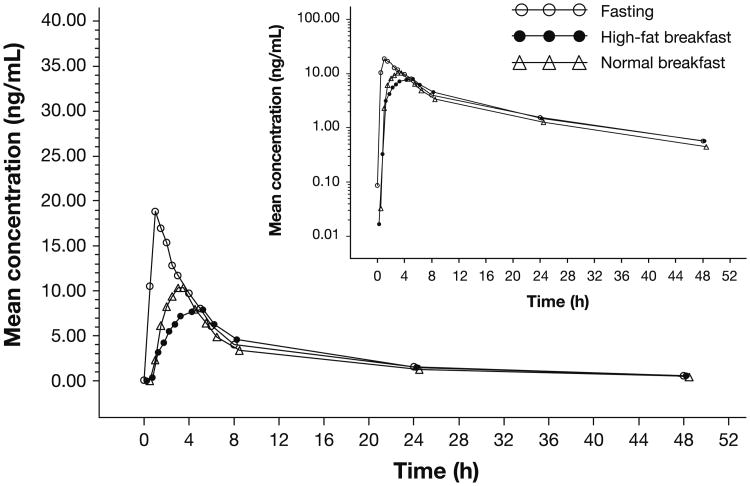
Fig. 2.
Panobinostat plasma concentration–time profiles following fasting and food consumption. Linear scale (inset semilogarithmic scale) of mean panobinostat plasma concentration versus time following the administration of a 20-mg dose after overnight fasting (open circle), a high-fat breakfast (closed circle), or a normal breakfast (open triangle)

