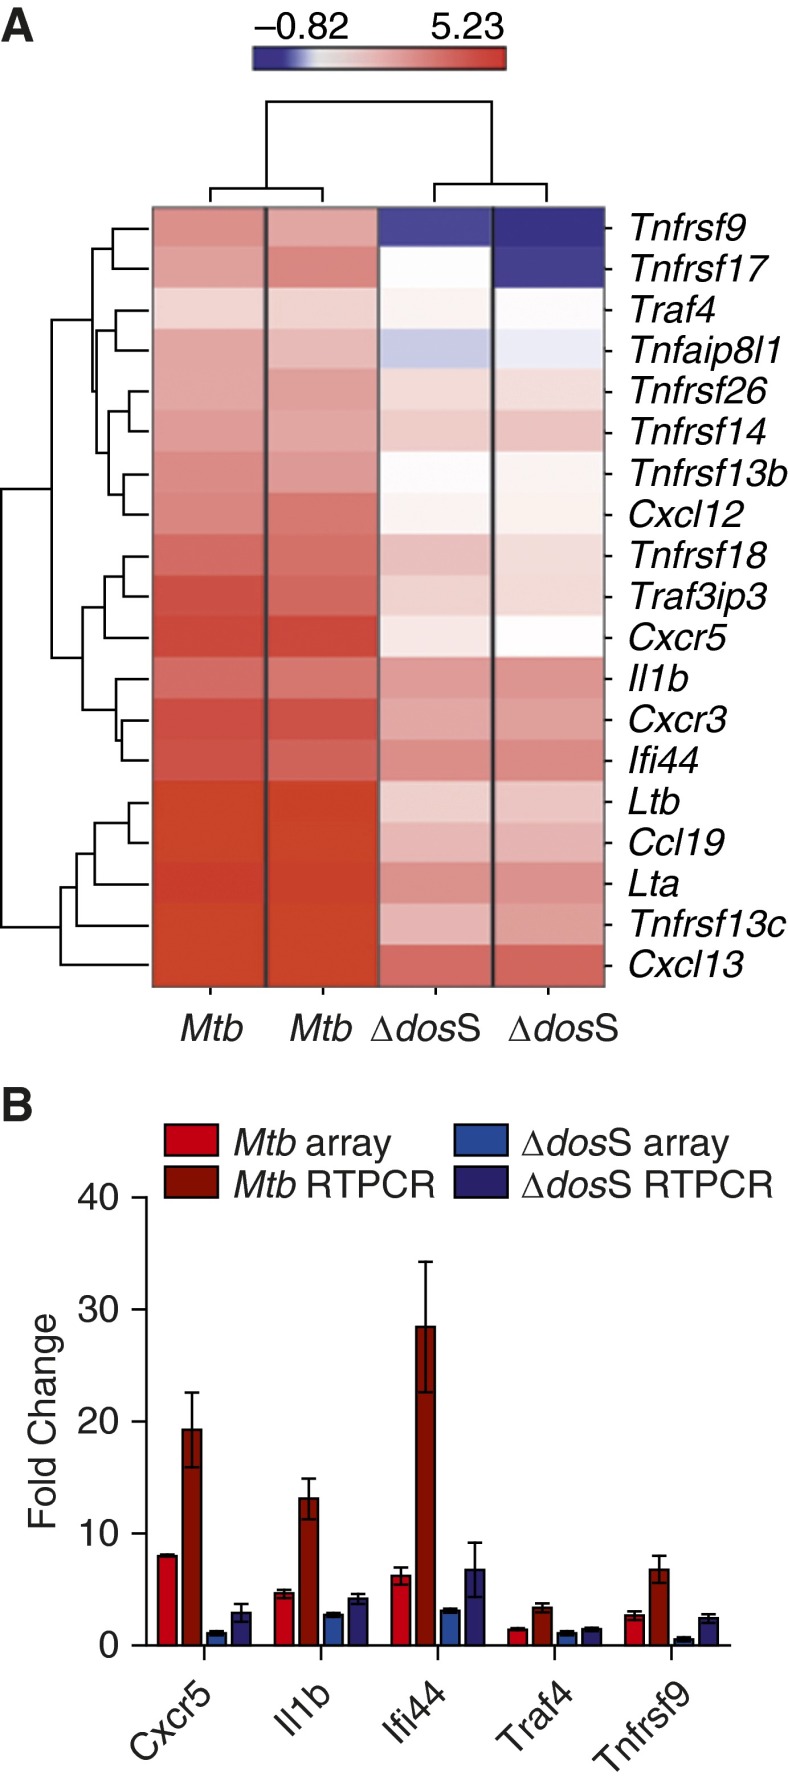
Figure 5.
Supervised hierarchical clustering and global gene-ontology analysis. (A) Expression of chemokines, interferons/co-regulated genes, and cytokines/TNF c-regulated genes in Mtb- and Δ-dosS-infected lungs at Week 8. The intensity of red color correlates with higher levels of induction; the intensity of blue color correlates with higher levels of repression relative to the expression of the same genes in Day 1 (baseline) animals. Bar represents the range of gene-expression magnitude. (B) The relative fold change in transcripts (Mtb-infected mice Week 8 to Mtb-infected mice, Day 1) or (∆-dosS-infected mice, Week 8, to ∆-dosS-infected mice, Day 1) in microarray (red or blue bars) and quantitative RT-PCR (dark red or dark blue bars) is shown.

