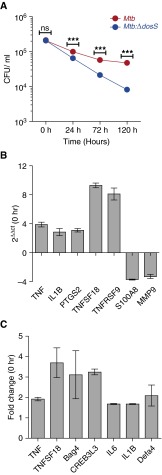
Figure 7.
Growth–phenotype comparison of Mtb:Δ-dosS to Mtb C3HeB/FeJ mouse–derived bone marrow–derived macrophages (BMDMs). (A) Growth of Mtb:Δ-dosS was compared with wild-type Mtb in IFN-γ–activated C3HeB/FeJ mouse–derived BMDMs. Mtb (red); Δ-dosS (blue). Bacterial counts were significantly different at and after 24 hours (P < 0.0001; unpaired t test). Each bar represents results from biological replicate experiments. (B) Fold change in regulation of selected genes by quantitative RT-PCR, microarray (C) in BMDMs infected with Δ-dosS relative Mtb. ***P < 0.005. ns, not significant.

