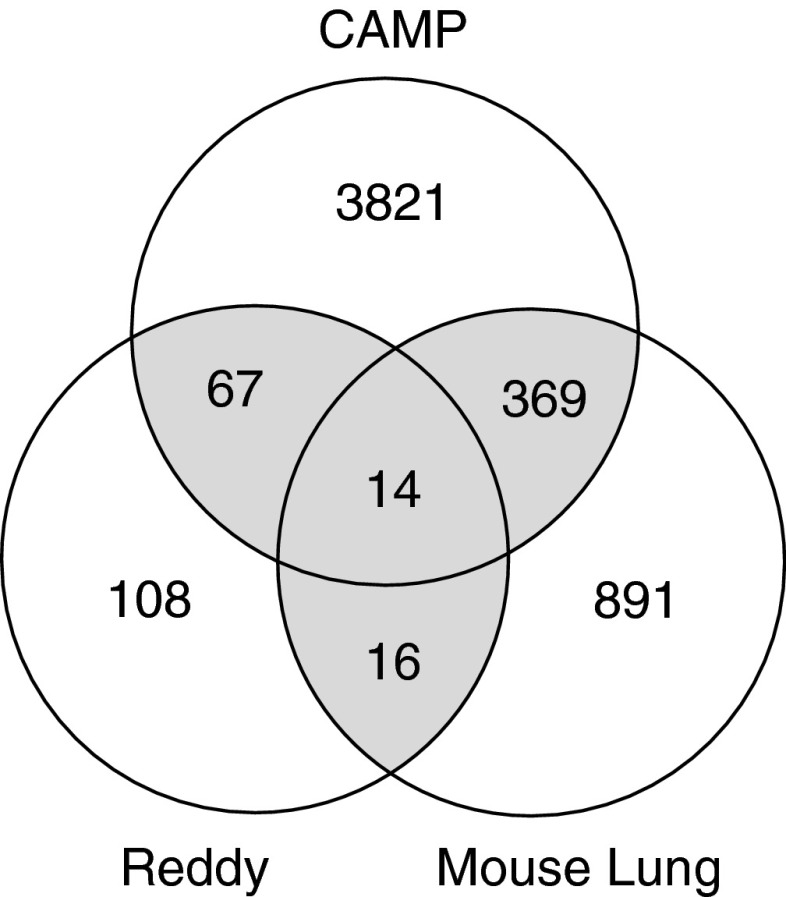
Figure 2.
Diagram demonstrating the genes identified by the independent genomic methodologies used for the identification of the GCGS. Genes shown demonstrate genes that were differentially expressed independent of direction. Only those genes that demonstrated consistent expression (either increased or decreased expression) after corticosteroid treatment in both datasets were included in the GCGS.

