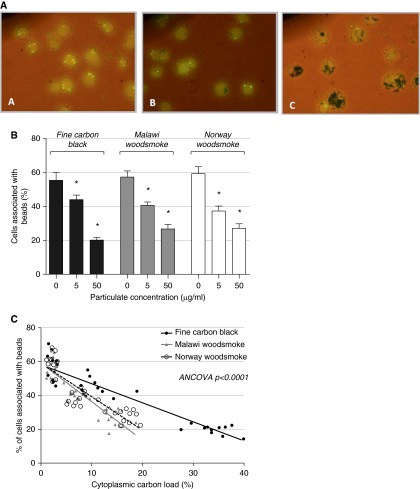
Figure 4.
Particulate exposure results in a dose-dependent reduction in fluorescent bead association by MDMs. MDMs were exposed to FCB, Malawi wood smoke particulates (MW), or Norwegian wood smoke particulates (NW). Phagocytosis was assessed by association or uptake of fluorescent beads. (A) Representative images obtained by fluorescence microscopy. Phagocytosis rates are shown in (B). Error bars indicate 95% CI. *P < 0.01 compared with no particulate challenge by one-way ANOVA with Tukey’s test. (C) The association between cytoplasmic particulate density and bead association, with linear model fitting for each particulate type. The model gradients are different by analysis of covariance (ANCOVA) testing (P < 0.001).

