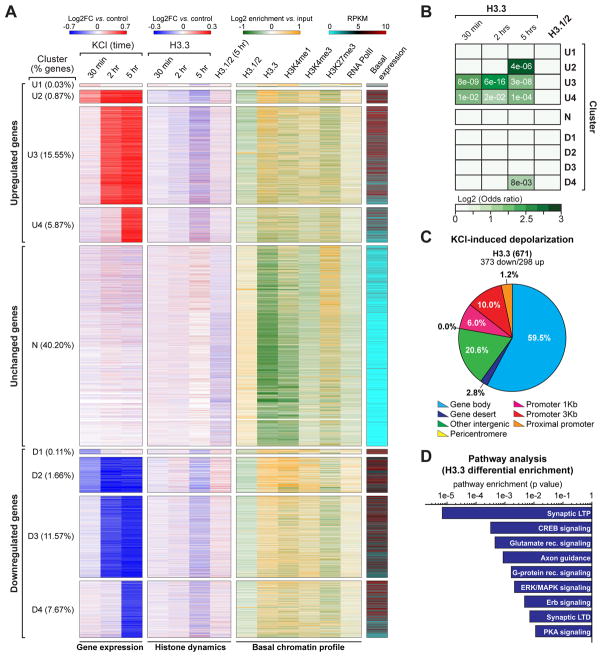
Figure 5. Neuronal histone dynamics correlate with late responsive activity-dependent enhancements in gene expression.
(A) Clustering analysis of primary cortical neuron transcriptional responses to KCl depolarization across time (30 min, 2 hrs and 5 hrs vs. respective non-stimulated controls). Data are displayed as heatmaps of nine representative clusters encompassing >83% of all detected genes. Up- (‘U’) and down- (‘D’) regulated genes were clustered into immediate early response genes (‘U1/D1’), immediate early-maintained genes (‘U2/D2’), early-late response genes (‘U3/D3’) and late-late response genes (‘U4/D4’), as well as unresponsive transcripts (‘N’). Histone dynamics (H3.3: 30 min, 2 hrs and 5 hrs; H3.1/2: 5 hrs) are depicted for each cluster of transcriptional response after depolarization. Basal chromatin peak enrichment profiles (H3.1/2, H3.3, H3K4me1, H3K4me3, H3K27me3 and RNA PolII), as well as basal state transcript expression, are similarly depicted. (B) Odds ratio analyses of differential enrichment events for H3.3 vs. activity-dependent gene expression across time for the nine clusters depicted in Figure 4A. Insert numbers (white) represent P values. (C) Genomic distribution of H3.3 differential enrichment events in response to KCl depolarization (5 hrs – late responsive genes) in mouse embryonic neurons. (D) Ingenuity Pathway Analysis (IPA) of late responsive genes displaying H3.3 differential enrichment following KCl stimulation (5 hrs) in mouse embryonic neurons. n values for sequencing experiments are provided in the Extended Experimental Procedures. See also Figure S5 and Supplemental Spreadsheet 2.

