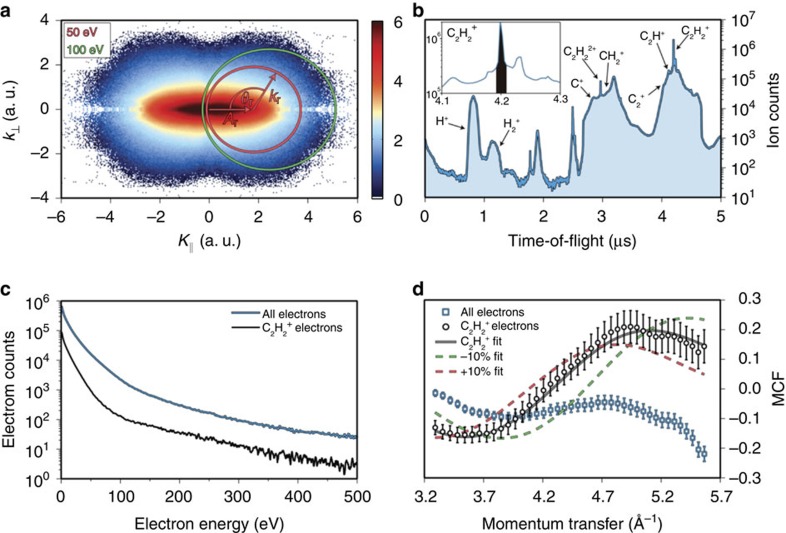
Figure 2. Method to extract structural information from the momentum distributions.
(a) Logarithmically scaled momentum distribution of electrons corresponding to all ionic fragments. The circles represent the scattering of electrons with the same energy at different angles. (b) The detected ion TOF showing the numerous fragments created during the strong-field interaction. The inset shows the peak corresponding to the C2H2+ ion near 4.2 μs and the shaded region represents the window of ions that the C2H2+ electrons are taken from. (c) The electron kinetic energy distribution for the C2H2+ ion (black) and for all possible fragmentation processes (blue). (d) An extracted MCF for the acetylene cation (black circles) as well as for electrons from all fragments (blue squares). The solid black curve shows the best fit, which matches very well with the cation channel. The MCFs for ±10% changes in the C2H2 molecular lengths (dashed curves) highlight the sensitivity of the LIED technique. The s.d. error bars are derived from Poissonian statistics.

