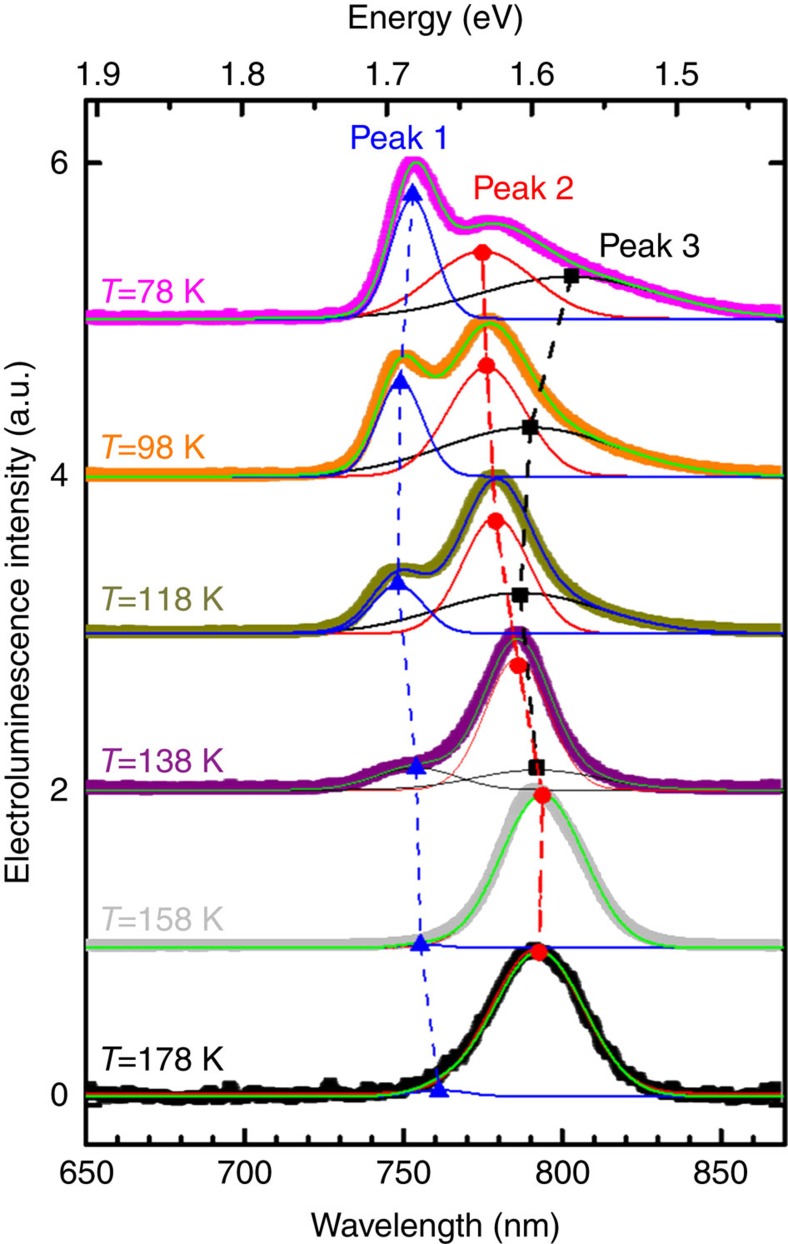
Figure 4. Low-temperature electroluminescence spectra of CH3NH3PbI3 LE-FET.
EL spectra collected at Vds=100 V, Vgs=100 V, normalized to their maximum peak. The spectra were fitted by three Gaussian curves (solid lines). The shift in peak position of the 750 nm peak (Peak 1, blue triangles), the 780 nm peak (Peak 2, red circles) and the 800 nm peak (Peak 3, black squares) is indicated by the dashed lines.

