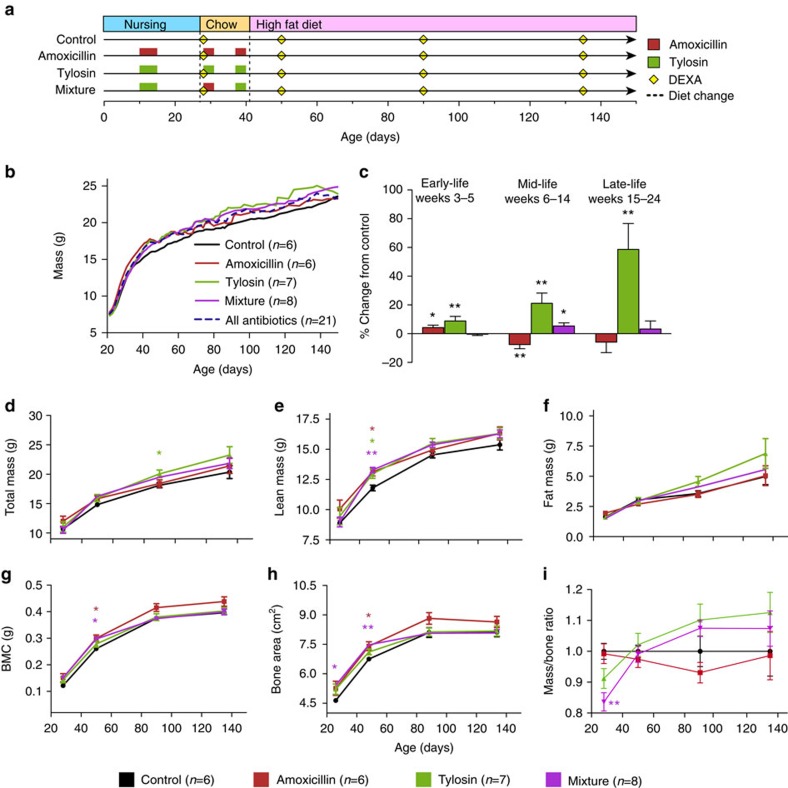
Figure 1. Effect of PAT on growth.
(a) Timeline of antibiotic pulses and dietary changes. (b) Scale weight of mice. (c) Growth rates in early-, mid-, and late-life expressed as percent difference from control. (d–h) Dual energy X-ray absorptiometry measurements. (d–f) Total, lean and fat mass; (g) bone mineral content (BMC) and (h) bone area. (i) Calculated total body mass-to-bone area ratio is represented as a fraction of control. *P<0.05, **P<0.01, ANOVA with Dunnett's post test. (c–h) Bars represent standard error of the mean. Number of mice: control, n=6; amoxicillin, n=6; tylosin, n=7 and mixture, n=8.

