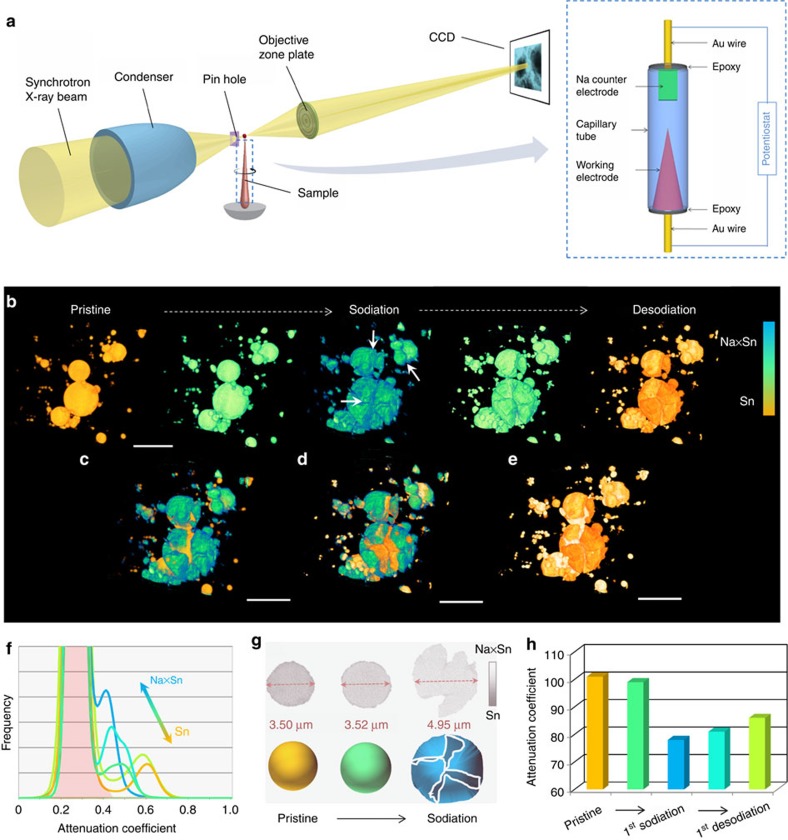
Figure 1. Visualization of three-dimensional (3D) microstructural evolution in NIB.
(a) Experimental setup and electrochemical cells. (b) 3D morphological change of Sn particles during the first sodiation–desodiation cycle. The colours in b represent the attenuation coefficient variation within the reconstructed images. Overlapped 3D views of Sn particles at different electrochemical stages: (c) pristine/sodiated, (d) sodiated/desodiated and (e) pristine/desodiated. The contrast of the overlapping colors (c–e) are adjusted for better visualization. (f) Normalized X-ray attenuation coefficient histogram during the first electrochemical cycle. (g) Schematic illustration showing the two-step sodiation process, which is supported by the cross-section images of selected particle shown above (grey), in which the initial sodiation process leads to negligible volume change. (h)The histogram information of attenuation coefficient change, which is correlated the above 3D morphological change to chemical information change. Scale bar, 10 μm.

