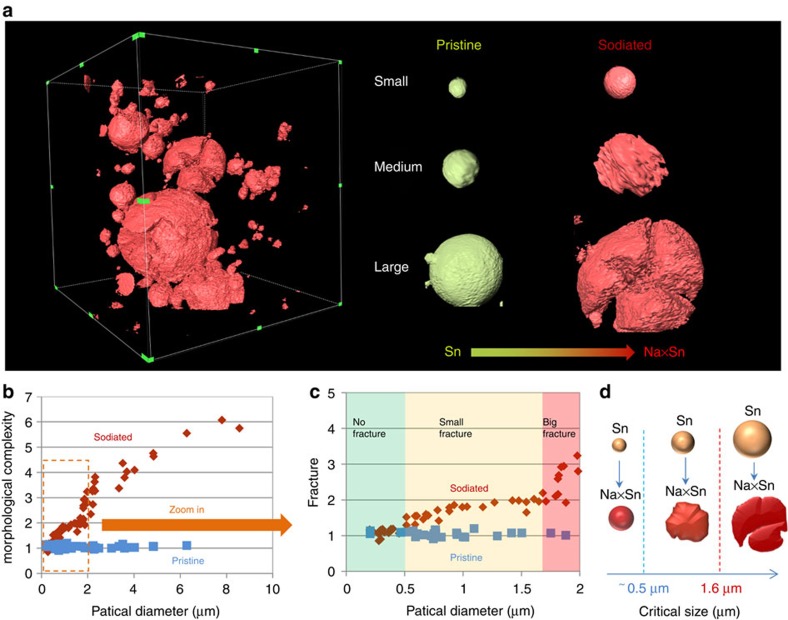
Figure 3. Statistical analysis of morphological complexity degree.
(a) 3D morphologies of the sodiated electrode and selected three particles with different size and fracture. (b) Size-dependent morphological complexity for the pristine and sodiated samples. (c) An enlarged plot showing three different fracture zone. (d) A schematic illustration gives the two critical sizes for Sn fracture in NIB.

