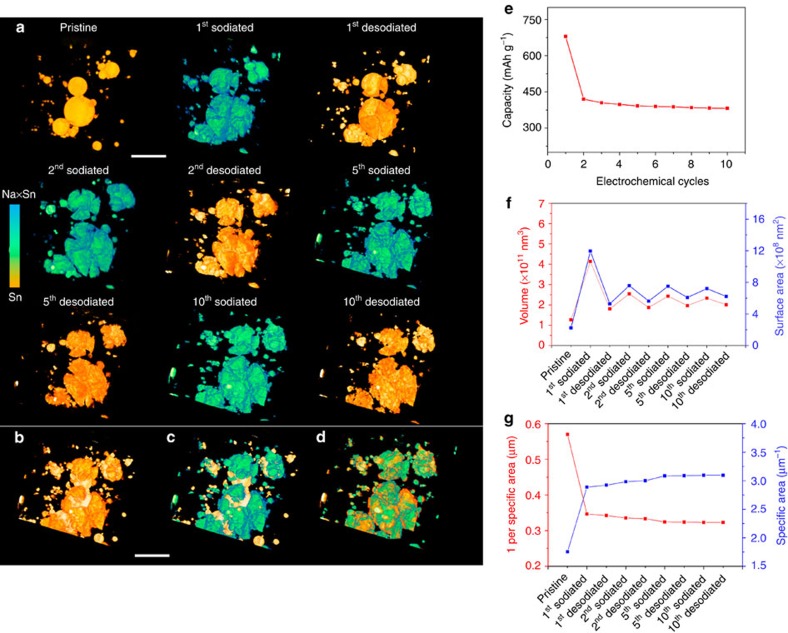
Figure 4. 3D view of microstructural equilibrium in NIB.
(a) microstructural reversibility during 10 sodiation–desodiation cycles; The overlapped images of (b) pristine/second desodiated, (c) pristine/tenth sodiated and (d) second sodiated/tenth desodiated. The contrast of the overlapping colors (b–d) are adjusted for better visualization. A microstructural equilibrium reaches since the second sodiation–desodiation process. (e) The electrochemical cycle performance; (f) volume and surface area change during the electrochemical cycles; (g) quantitative specific area change during the electrochemical cycles. Scale bar, 10 μm.

