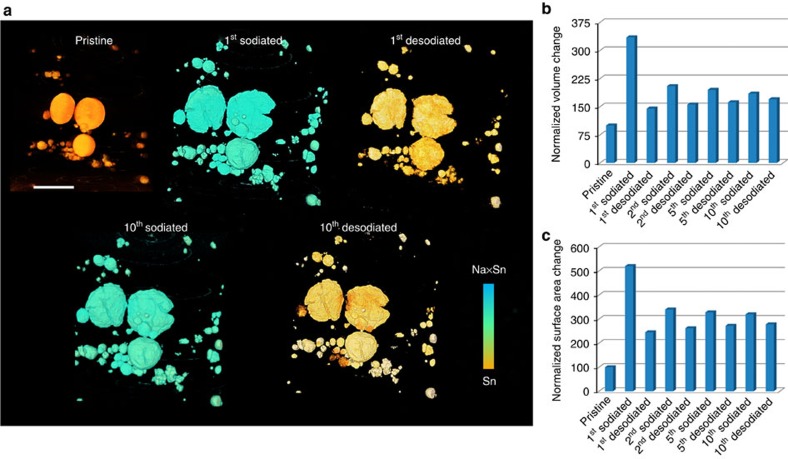
Figure 5. 3D microstructural equilibrium of another Sn electrode in NIB.
(a) 3D morphologies of the Sn electrode during 10 electrochemical cycles. (b) The statistical analysis of volume change during the 10 cycles. (c) The statistical analysis of surface area change during the ten electrochemical cycles. Scale bar, 10 μm.

