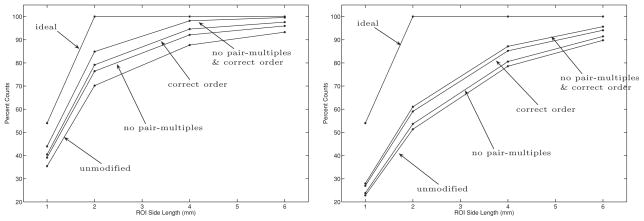
Figure 9.
The percentage of LORs that get backprojected (using focal plane tomography) into square-shaped regions of interest (ROI) centered at the location of the point source. The data labeled no pair-multiples show the results of the coincidences without pair-multiples interactions. The data labeled correct order assume that the order of the signals is known. The left plot shows the results with Bayes I and the right shows the results with Bayes IV.

