
. 2015 Jul 4;15:144. doi: 10.1186/s12884-015-0571-7
© Ngo et al. 2015
This is an Open Access article distributed under the terms of the Creative Commons Attribution License (http://creativecommons.org/licenses/by/4.0), which permits unrestricted use, distribution, and reproduction in any medium, provided the original work is properly credited. The Creative Commons Public Domain Dedication waiver (http://creativecommons.org/publicdomain/zero/1.0/) applies to the data made available in this article, unless otherwise stated.
Fig. 1.
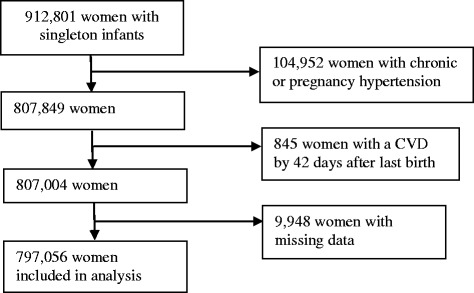
Flow chart of selection of women for analysis