
Fig. 1.
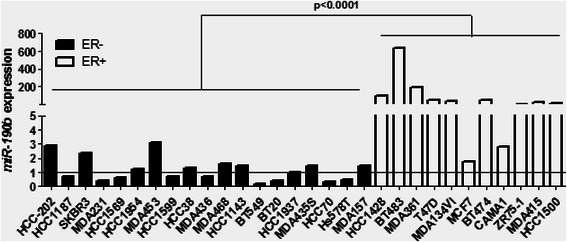
Expression levels of miR-190b in breast cancer cell lines. Representation of miR-190b relative expression level in 30 breast cancer cell lines. For each cell line, the miRNA levels were normalized such that the median value of the ER− breast cancer cell lines was 1 (horizontal line)