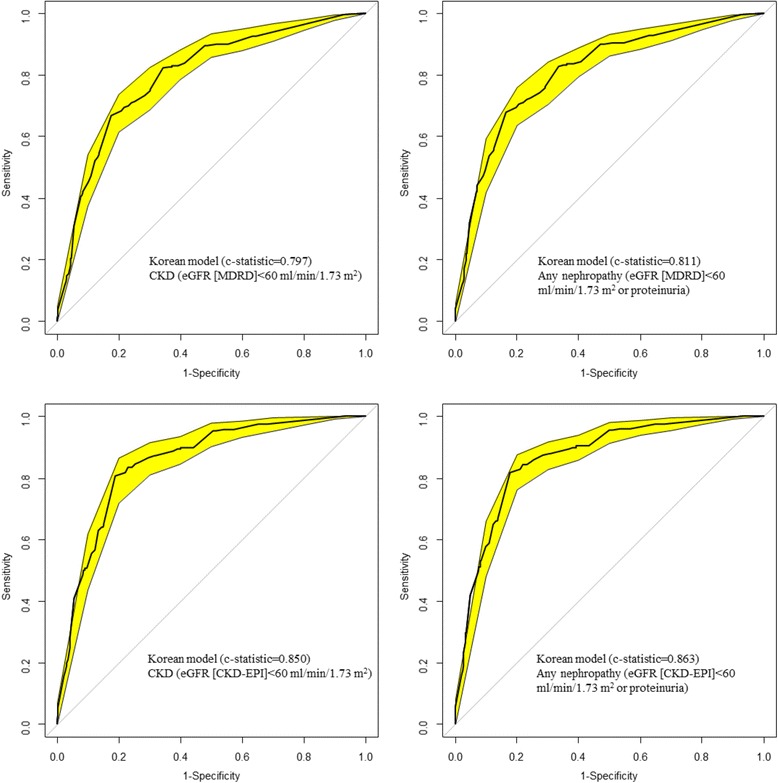
Fig. 1.

Receiver operating characteristic curves (ROC) showing the discrimination of the Korean model. The yellow band around curve represents the 95 % confidence interval; the diagonal line at 45° is the line of no discrimination. Figure panels are for the outcome of CKD (eGFR < 60 ml/min/1.73 m2) for the left panels and ‘any nephropathy (eGFR < 60 ml/min/1.73 m2 or proteinuria) for the right panels, and for MDRD defined CKD (upper panels) and CKD-EPI defined CKD (lower panels)
