
Fig. 1.
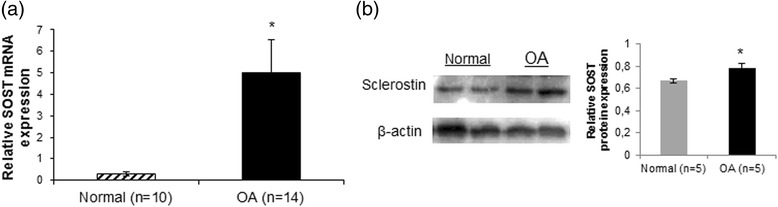
SOST mRNA and protein expression levels in normal and osteoarthritis (OA) chondrocytes. a Quantitative SOST mRNA expression in cultured normal (n = 10) and OA chondrocytes (n = 14). GAPDH was used for normalization of the real-time PCR data (error bars = standard error, *p = 0.005). b Representative western blot of SOST protein expression in cultured normal and OA chondrocytes and a bar graph showing relative SOST protein expression normalized to β-actin in normal (n = 5) and OA chondrocytes (n = 5) (error bars = standard error, *p = 0.038)