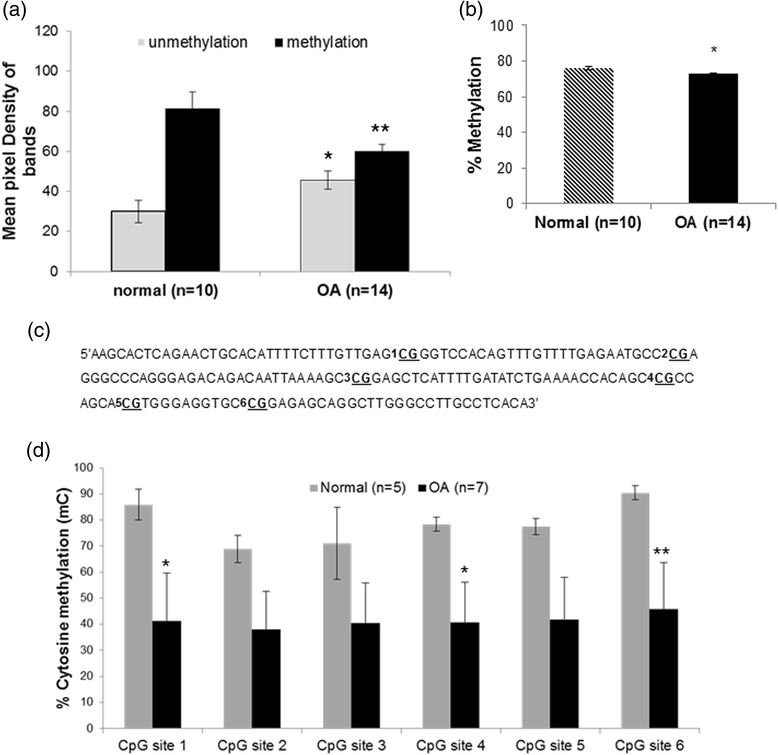
Fig. 2.

DNA methylation status of the SOST promoter in normal and osteoarthritis (OA) chondrocytes. a DNA methylation status of CpG island located upstream of the transcript start site (TSS) in the region of the SOST promoter in cultured normal (n = 10) and OA chondrocytes (n = 14) (error bars = standard error, *p = 0.05 versus normal unmethylation status, **p = 0.043 versus normal methylation status). b DNA methylation values in the CpG-rich region of the SOST promoter in cultured normal (n = 10) and OA chondrocytes (n = 10) by qMSP (error bars = standard error, *p = 0.004). c Schematic representation of the CpG-rich region of the SOST promoter showing the six CpG sites that were analyzed using the bisulfite DNA sequencing method. d The percentage of cytosine methylation of each CpG site located at the CpG region of the SOST promoter in cultured normal (n = 5) and OA chondrocytes (n = 7), after bisulfite DNA sequencing analysis (error bars = standard error, *p = 0.05 and **p = 0.046)
