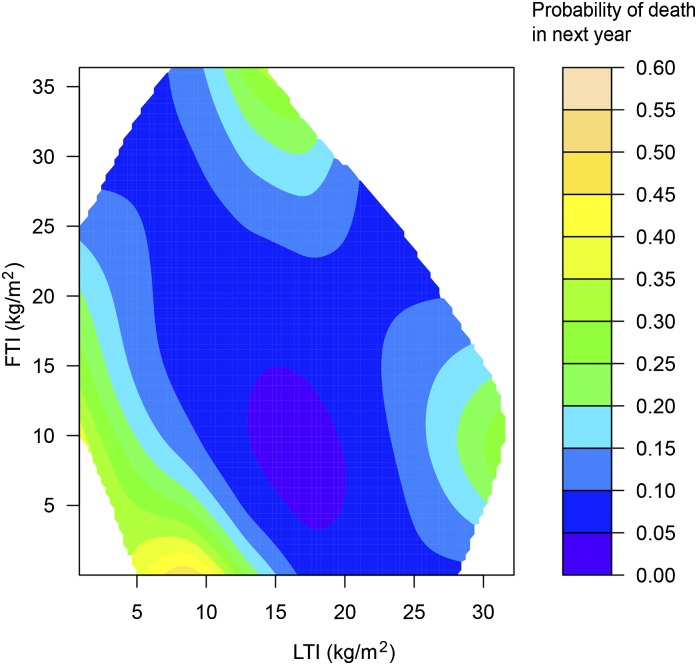
Figure 1.
Risk of death across levels of FTI and LTI. Contour plot of the estimated probability of death in the next year as a joint function of LTI and FTI for female patients with age and body mass index fixed at their median values. Estimates of the joint effects are shown in a region with sufficient data decided by posterior SDs. FTI, fat tissue index; LTI, lean tissue index.

