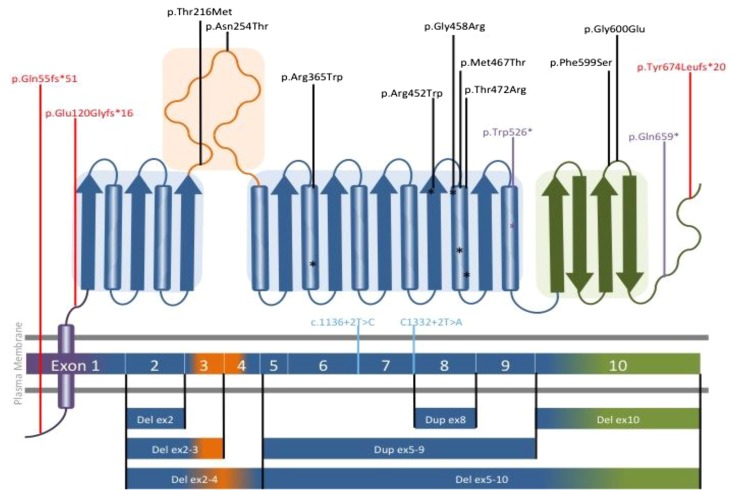
Figure 2.
Distribution of mutations detected in SLC3A1 (rBAT) throughout the exons and protein domains. Schematic diagram of rBAT and a homology model of the extracellular domain of rBAT on the basis of the crystal structure of oligo-1,6-glucosidase from Bacillus cereus (Protein Data Bank ID code 1UOK). The domains of rBAT are shown in purple (TMD), blue (domain A), orange (domain B [subdomain]), and green (domain C). Mutations are labeled as follows: missense in black, nonsense in purple, frameshift in red, and splice site in pale blue. Mutations predicted to fall within α-helices are denoted by asterisks of the appropriate color. TMD, trans-membrane domain.

