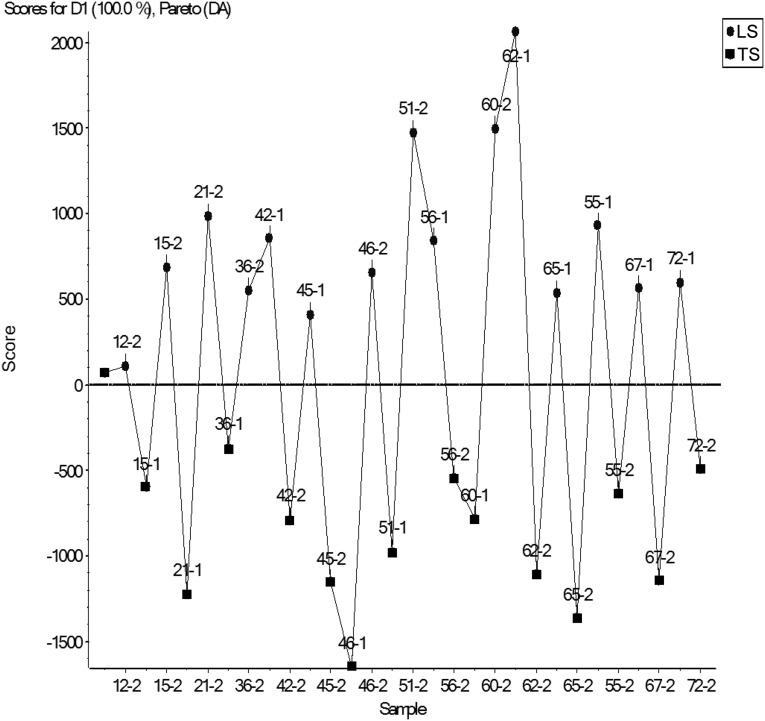
Figure 2.
Results of supervised principal component analysis and discriminant analysis. The results are shown by subject identification number. The Pareto algorithm was used for scaling. Ovals and squares represent the low sodium and typical sodium conditions, respectively. D1, discriminant 1; DA, discriminant analysis; LS, low sodium; TS, typical sodium.

