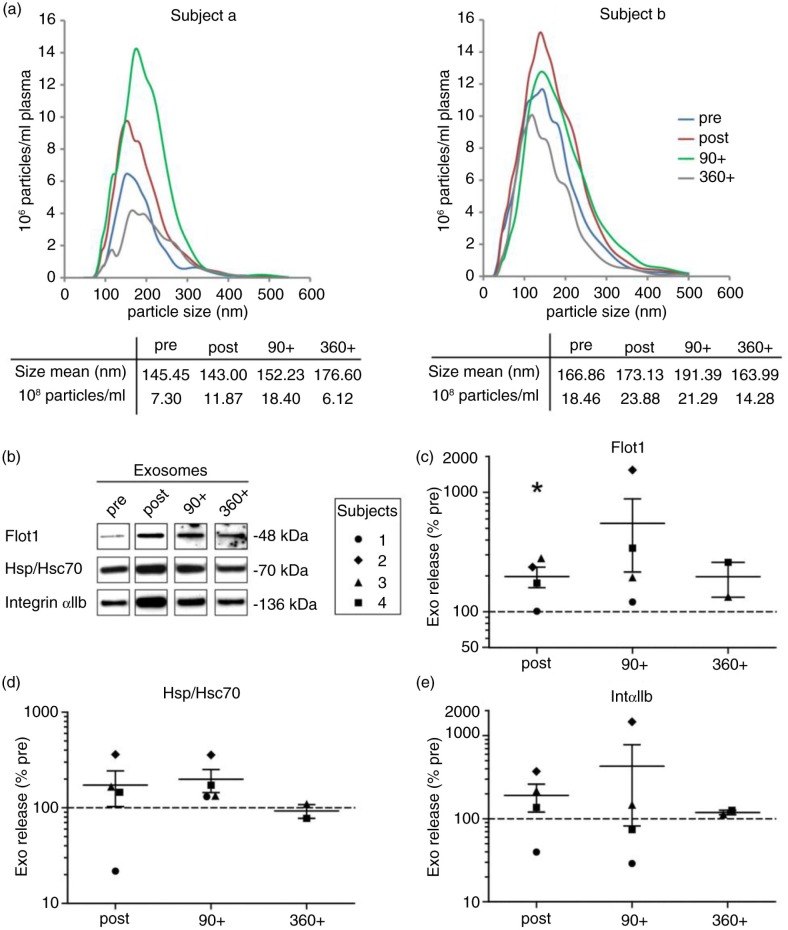
Fig. 3.
Effect of running exercise on plasma small EVs. Plasma samples were taken pre, post, 90 post (90+) and 360 post (360+) treadmill exercise. Pellets of 100,000×g were analyzed for particle size and concentration by NTA [(a) subjects a and b] and for protein composition by Western blotting [(b) subjects 1–4]. Signal intensities of Flot1 (c), Hsp/Hsc70 (d) and IntαIIb (e) were quantified (pre/post/90+: n=4, 360+: n=2, p<0.05, Student's t-test).

