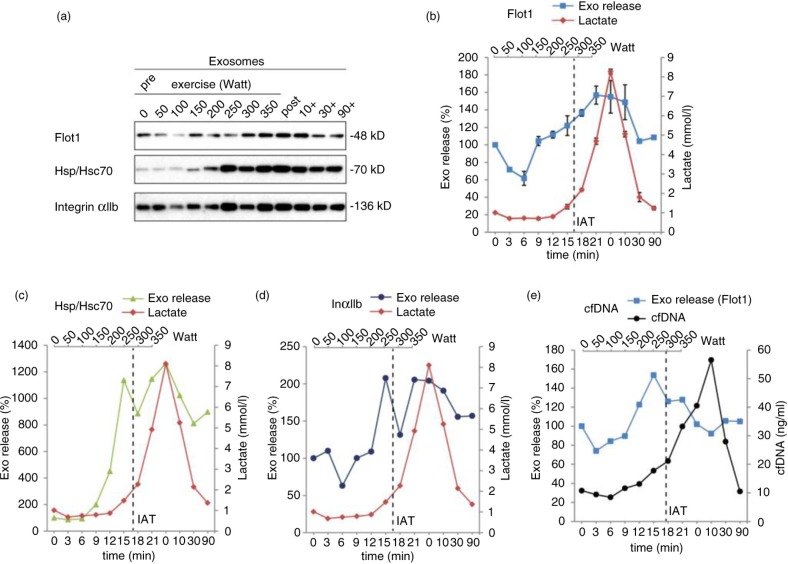
Fig. 4.
Kinetic analysis of small EV release during incremental cycling exercise. Kinetics of exosome, lactate (a–d) and cfDNA (e) release were recorded during and after an incremental cycling exercise (n=2, same subject). Plasma samples taken after each increment and post exercise were subjected to differential centrifugation, and small EVs were analyzed by Western blot (a). Western Blot signals were quantified for Flot1 (b, n=2), Hsp/Hsc70 (c, n=1) and IntαIIb (d, n=1). The individual anaerobic threshold (IAT) is indicated as vertical dashed line.

