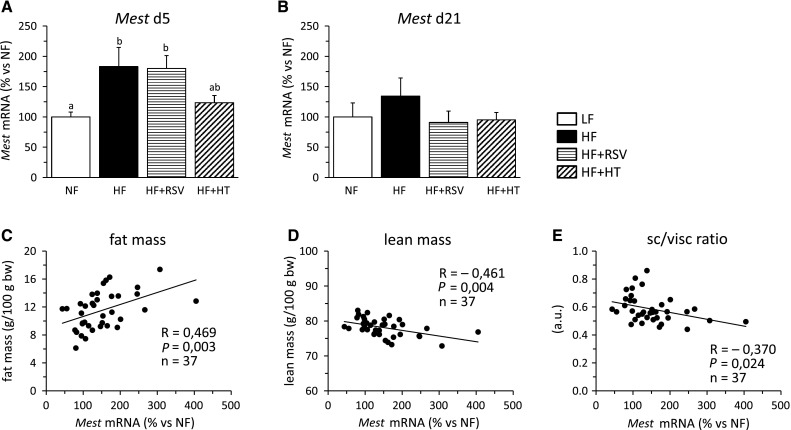
Fig. 4.

mRNA expression levels of Mest in whole blood at day 5 (a) and 21 (b) and correlation of whole blood Mest mRNA levels at day 5 with body fat mass (c) and lean body mass (d) at day 20, and with subcutaneous/visceral fat ratio (e) at the end of the experiment (day 21) in groups of animals as defined in the legend to Fig. 2. Gene expression data are means + SEM (n = 8–10). Significant differences between groups were tested by one-way ANOVA and least-significant difference (LSD) post hoc comparisons (P < 0.05). Values not sharing a common letter are statistically different. The correlation analyses were performed with all animals. Pearson’s correlation indexes, statistical significance and n are indicated
