Fig 3.

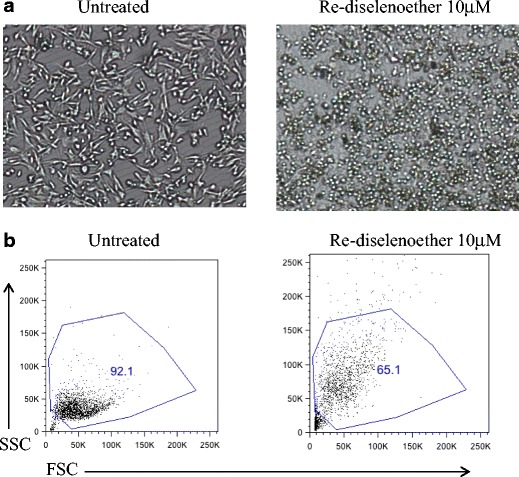
a Light microscopy images (5x objective) and (b) Flow cytometry dot plots comparing MDA-MB231 cells that have been exposed or not to 10 μM of the Re-diselenoether complex for 48 h

a Light microscopy images (5x objective) and (b) Flow cytometry dot plots comparing MDA-MB231 cells that have been exposed or not to 10 μM of the Re-diselenoether complex for 48 h