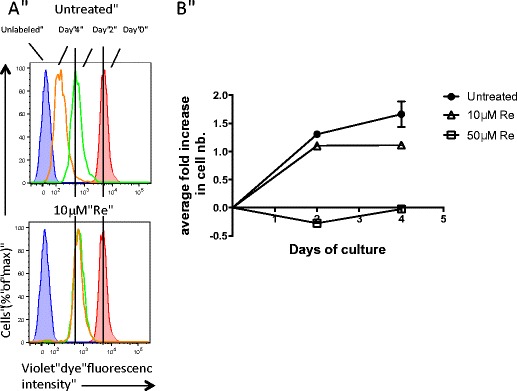
Fig. 4.

a Flow histograms of MDA-MB231 cells untreated or treated with 10 μM Re and analyzed for violet fluorescence intensity at the indicated time points. Plots show histograms of unlabeled control cells (shaded blue), cells labeled with violet dye at d0 prior culture (shaded red) and cells with decreasing amount of violet dye at d2 (green) and d4 (orange) due to a dilution of the violet dye upon cellular division. Data are representatives of 3 independent experiments. b Average fold increase in cell number over 4 days of culture in the presence of 0, 10 or 50 μM of Re complex. Data represents the mean ± SEM values pooled from 2 independent experiments
