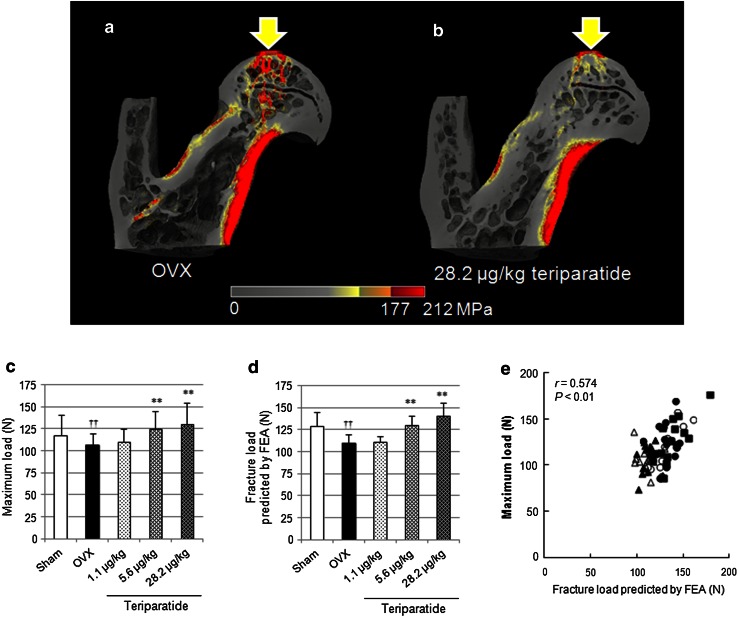
Fig. 5.
a, b Von Mises stress distribution with an axial compressive load on the top of the femoral head in proximal femoral models of the OVX (a) and 28.2 μg/kg teriparatide (b) groups. c Mechanical strength and d fracture load predicted by FEA. **P < 0.01: teriparatide versus OVX (Dunnett’s test); †† P < 0.01: OVX versus sham (t test). e Correlation between the maximum load determined by mechanical testing and fracture load predicted by FEA

