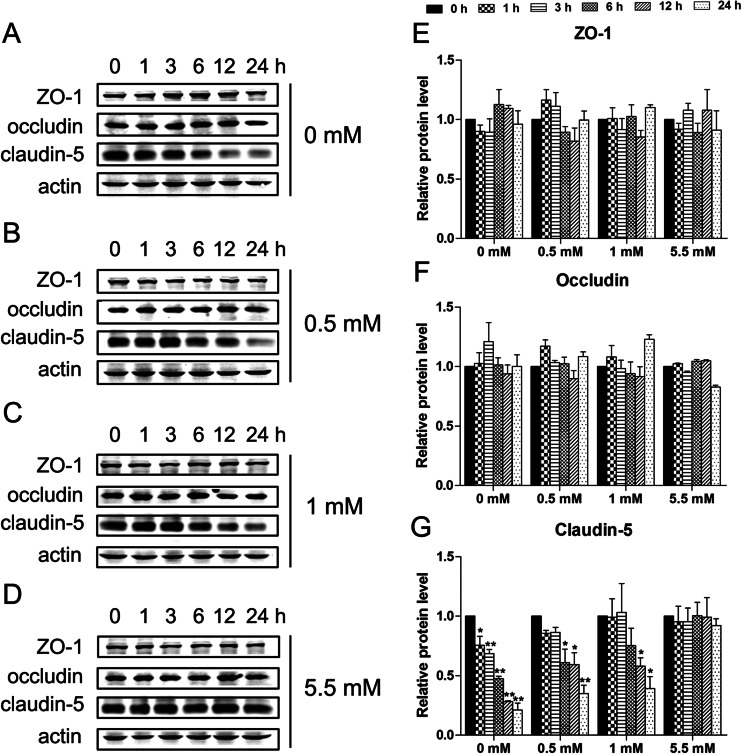
Fig. 2.
Effects of hypoglycemia on TJ proteins in bEnd.3 cells. Confluent bEnd.3 monolayers were exposed to 0 mM (a), 0.5 mM (b), 1 mM (c), or 5.5 mM (d, control) glucose for 1, 3, 6, 12, or 24 h. Representative blots for ZO-1, occludin, claudin-5, and β-actin are shown. Summary plots of ZO-1 (e), occludin (f), and claudin-5 (g) expression, including densitometric reading of the corresponding protein blots, are shown. Data are expressed as the mean ± SEM. N = 3. * P < 0.05, ** P < 0.01

