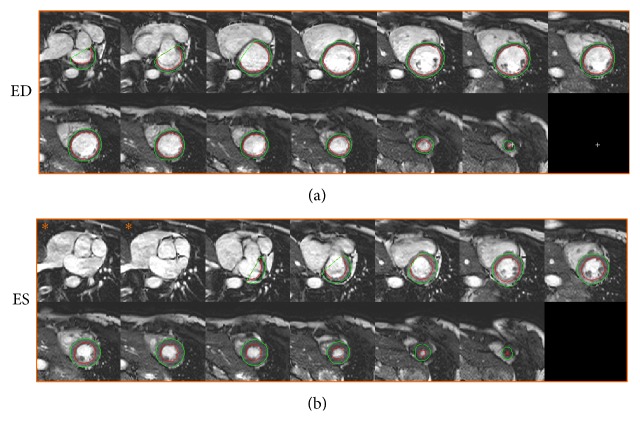
Figure 4.
Example of segmentation in end-diastole and end-systole. An example of automatic segmentation is shown in end-diastole (a) and end-systole (b). Each panel shows the short axis stack covering the left ventricle from base to apex with endocardial (red) and epicardial (green) segmentations. Note how the outflow tract has moved out of the two most basal slices in end-systole (b, images marked ∗), compared to end-diastole (a) and that the algorithm has automatically corrected for this long-axis motion.

