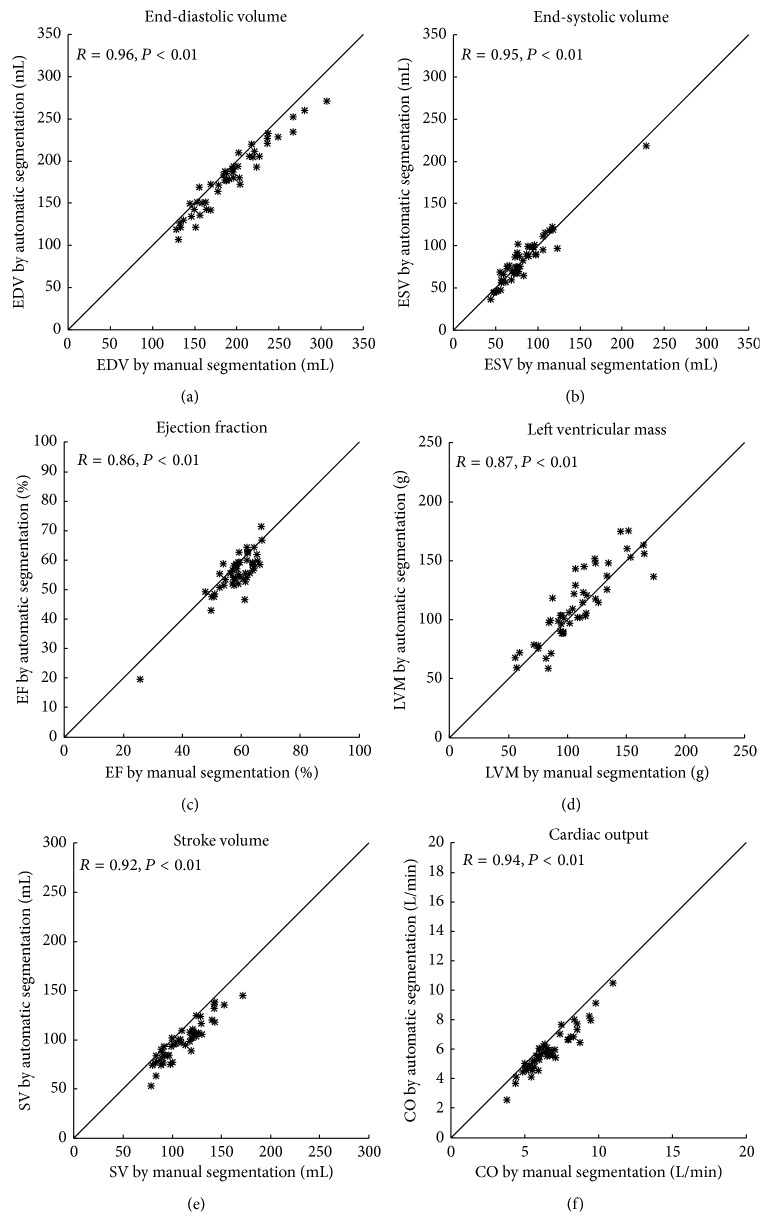
Figure 6.
Correlations between automatic segmentation and manual delineation in the test set. Automatic segmentation plotted against manual delineation for end-diastolic volume (EDV, (a)), end-systolic volume (ESV, (b)), ejection fraction (EF, (c)), left ventricular mass (LVM, (d)), stroke volume (SV, (e)) and cardiac output (CO, (f)). The line indicates the line of identity.

