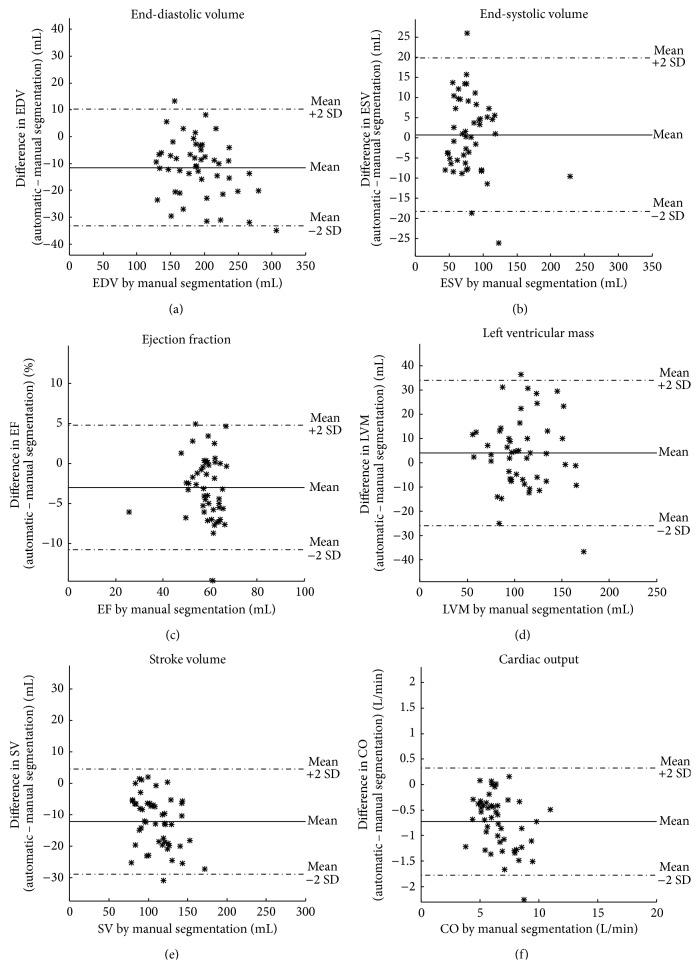
Figure 7.
Bias between automatic segmentation and manual delineation in the test set. Differences between automatic segmentation and manual delineation plotted against manual delineation for end-diastolic volume (EDV, (a)), end-systolic volume (ESV, (b)), ejection fraction (EF, (c)), left ventricular mass (LVM, (d)), stroke volume (SV, (e)) and cardiac output (CO, (f)). Solid line indicates mean and dashed lines indicate mean ± 2SD.

