Figure 2.

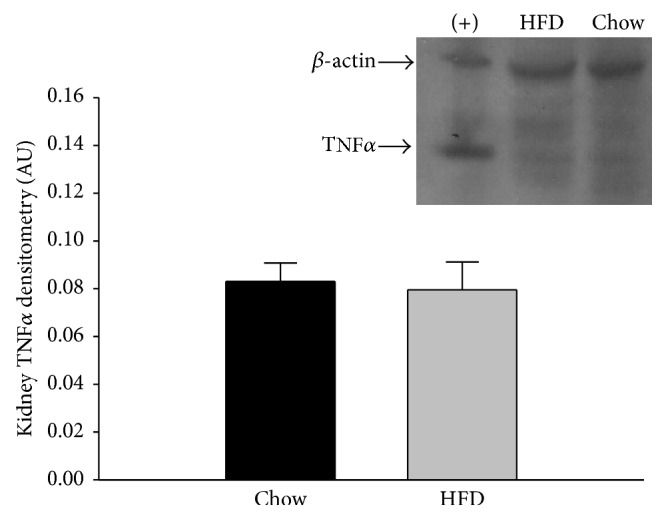
Renal tissue TNFα protein expression in chow and HFD rats. There was no difference in the TNFα expression of the two diet groups (n = 8/group). Retroperitoneal adipose tissue from a HFD rat was used as a positive control (+) and is shown in the first column. Data were analyzed by Student's t-tests and are expressed as means ± SEM. p = 0.803.
