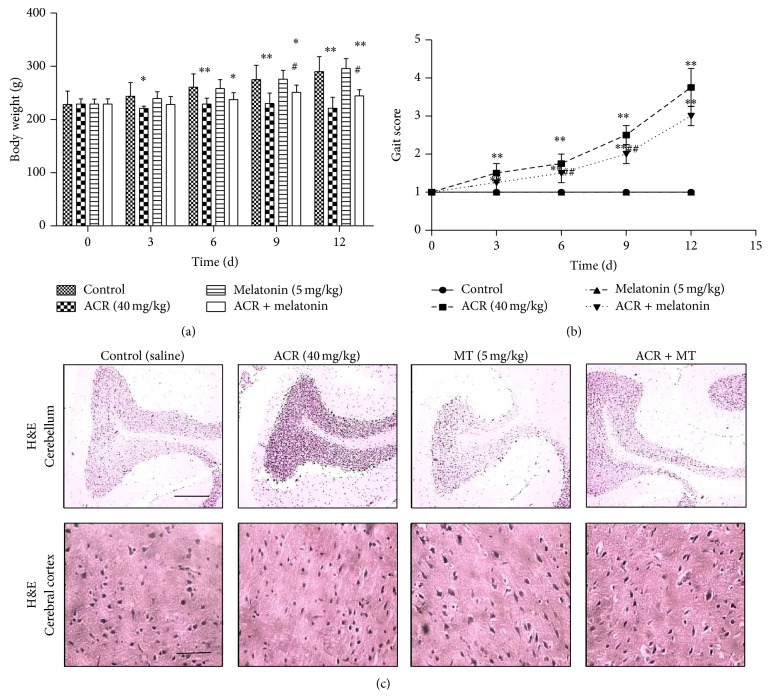
Figure 2.
Effects of MT on behavior toxicity of rats and morphology of different brain regions. Experimental rats were divided into four groups: control (equal volume saline) group, ACR (40 mg/kg/day) treatment group, MT (5 mg/kg/day, i.p) treatment group, and ACR + MT simultaneously treatment group. Body weight (a) and gait of rats (b) were analyzed after ACR oral administration with or without MT for 0, 3, 6, 9, and 12 days. H&E staining was used to observe morphological alterations of nerve cells, and the photographs were taken under a light microscope (scale bar: 100 μm) (c). The results are expressed as the mean ± SD (n = 8). ∗ P < 0.05, ∗∗ P < 0.01 versus the vehicle control group, # P < 0.05, ## P < 0.01 versus the ACR treatment group.

